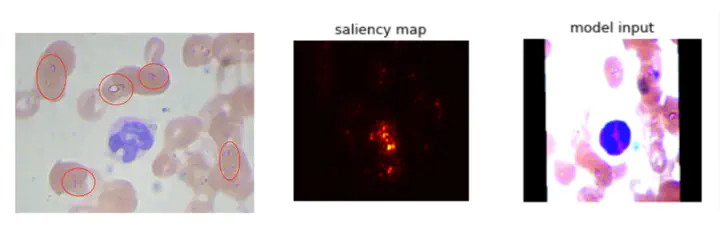
This project using deep learning method to do the classification for the blood smear images.
We test and compared three classic classification model here: ResNet, EfficientNet and the AlexNet.
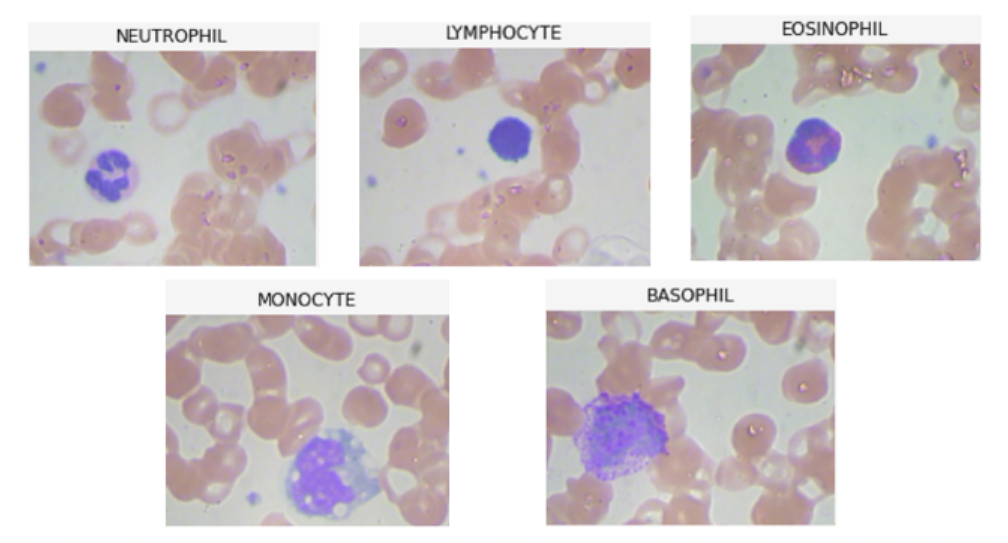
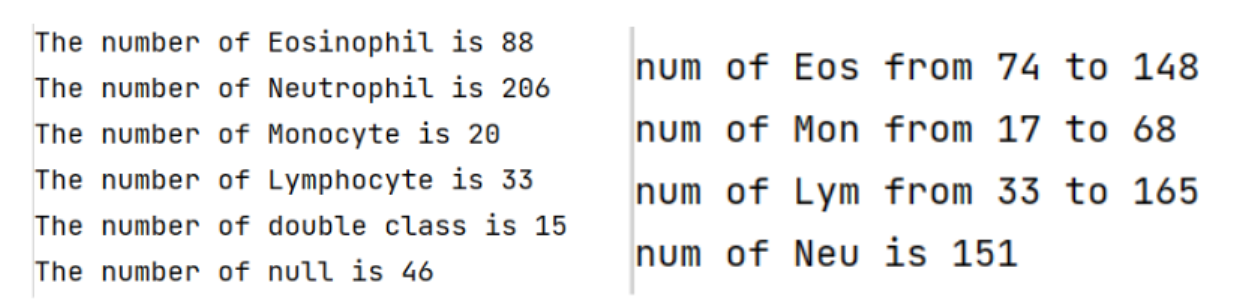
The row dataset containing 410 images for 5 classes:
We clean the data by:
Delete 10% of the Neutrophil
Training the less-amount class multi-time
Drop the Basophil class
Drop the double class
Drop the null class
Dataset distribution after cleaning
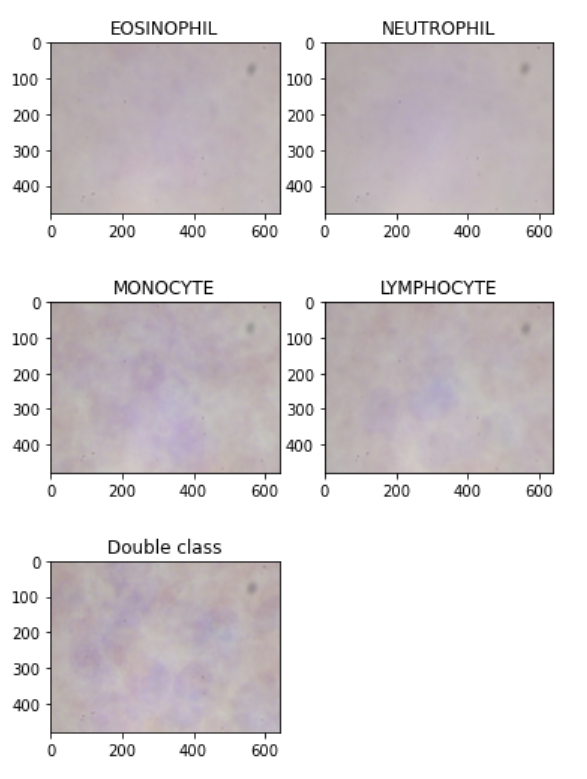
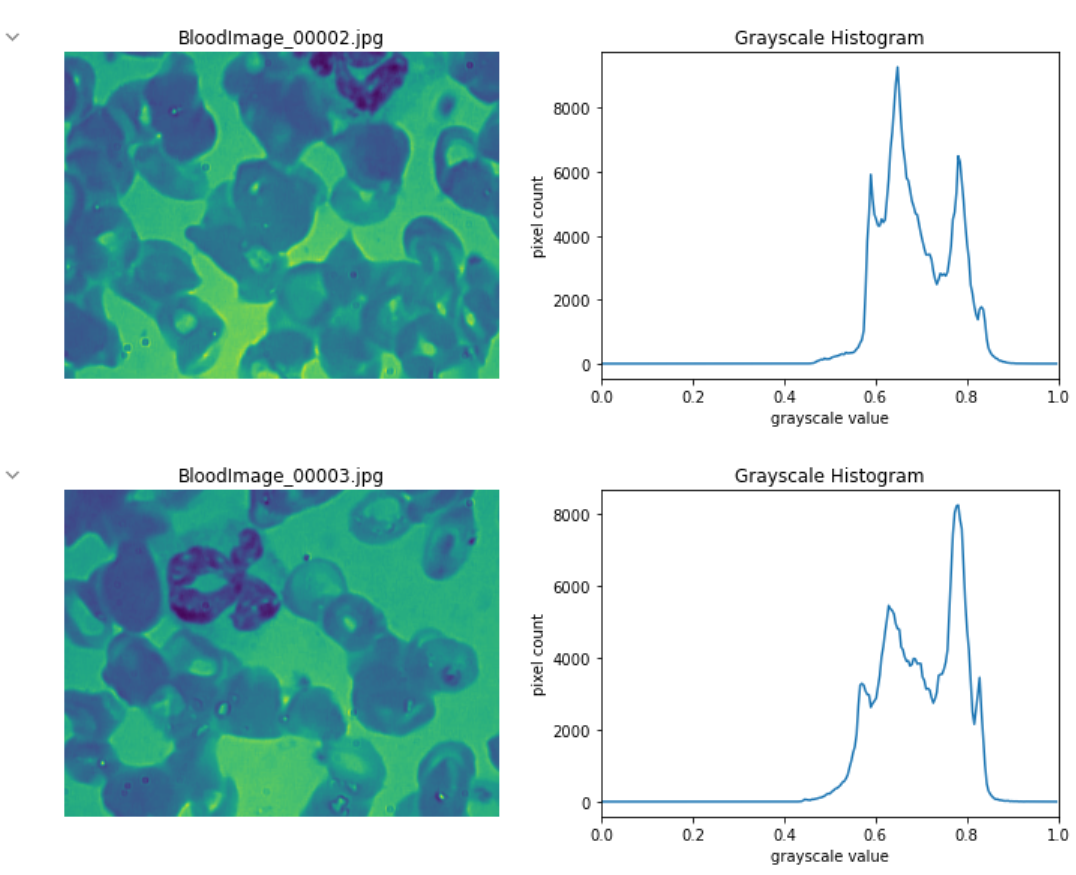
Also, I do the data exploration by drawing the pixel distribution and average images.
average images for each class
Pixel distribution
Model selection
ResNet
This model solved the degradation problem: As the network became deeper and deeper, the error begin to increase - hard to converge.
Not caused by overfitting, because the training error is also increase
Not caused by gradients vanishing/exploding, because this problem has been largely addressed by normalization layers.
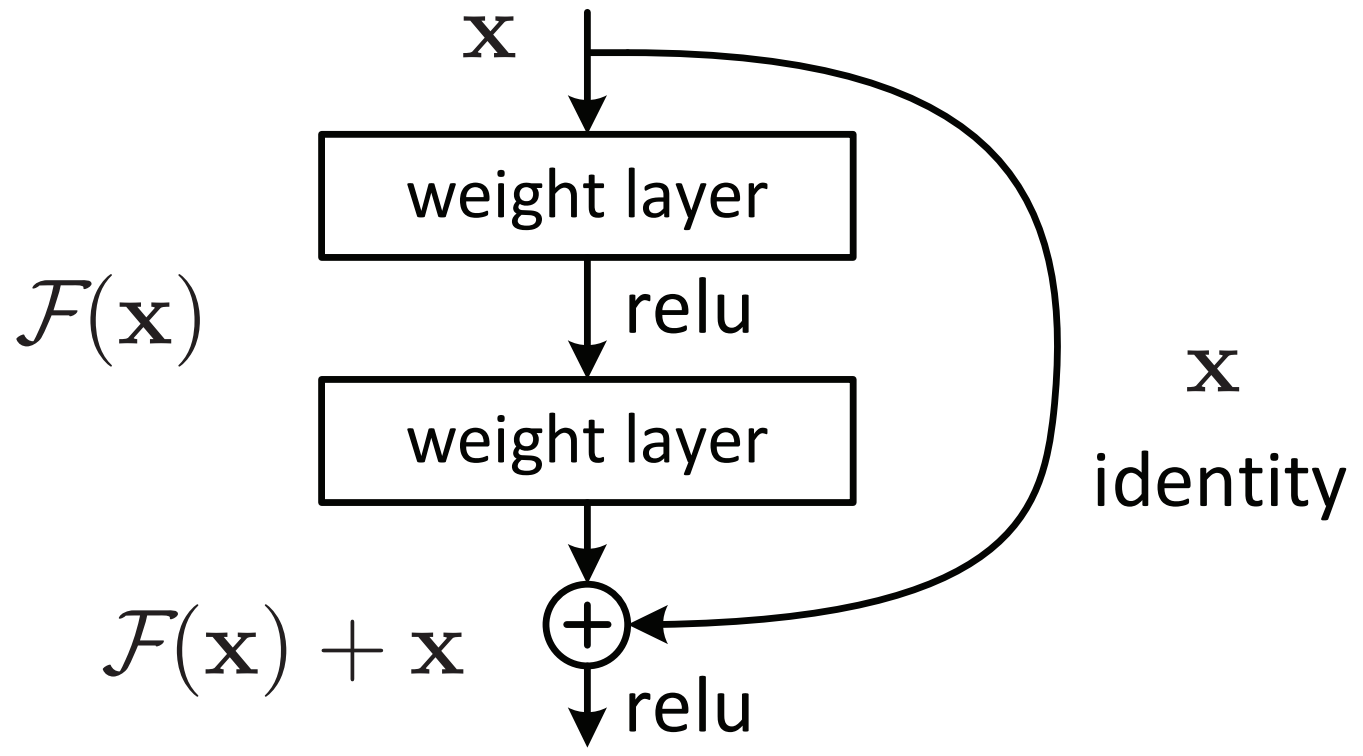
Core concept - the residual block
The target weight is near the identity.
A identity map adding the block-beginning layer feature to the block-ending layer.
Solve the degradation problem.
Residual learning: a building block.
EfficientNet
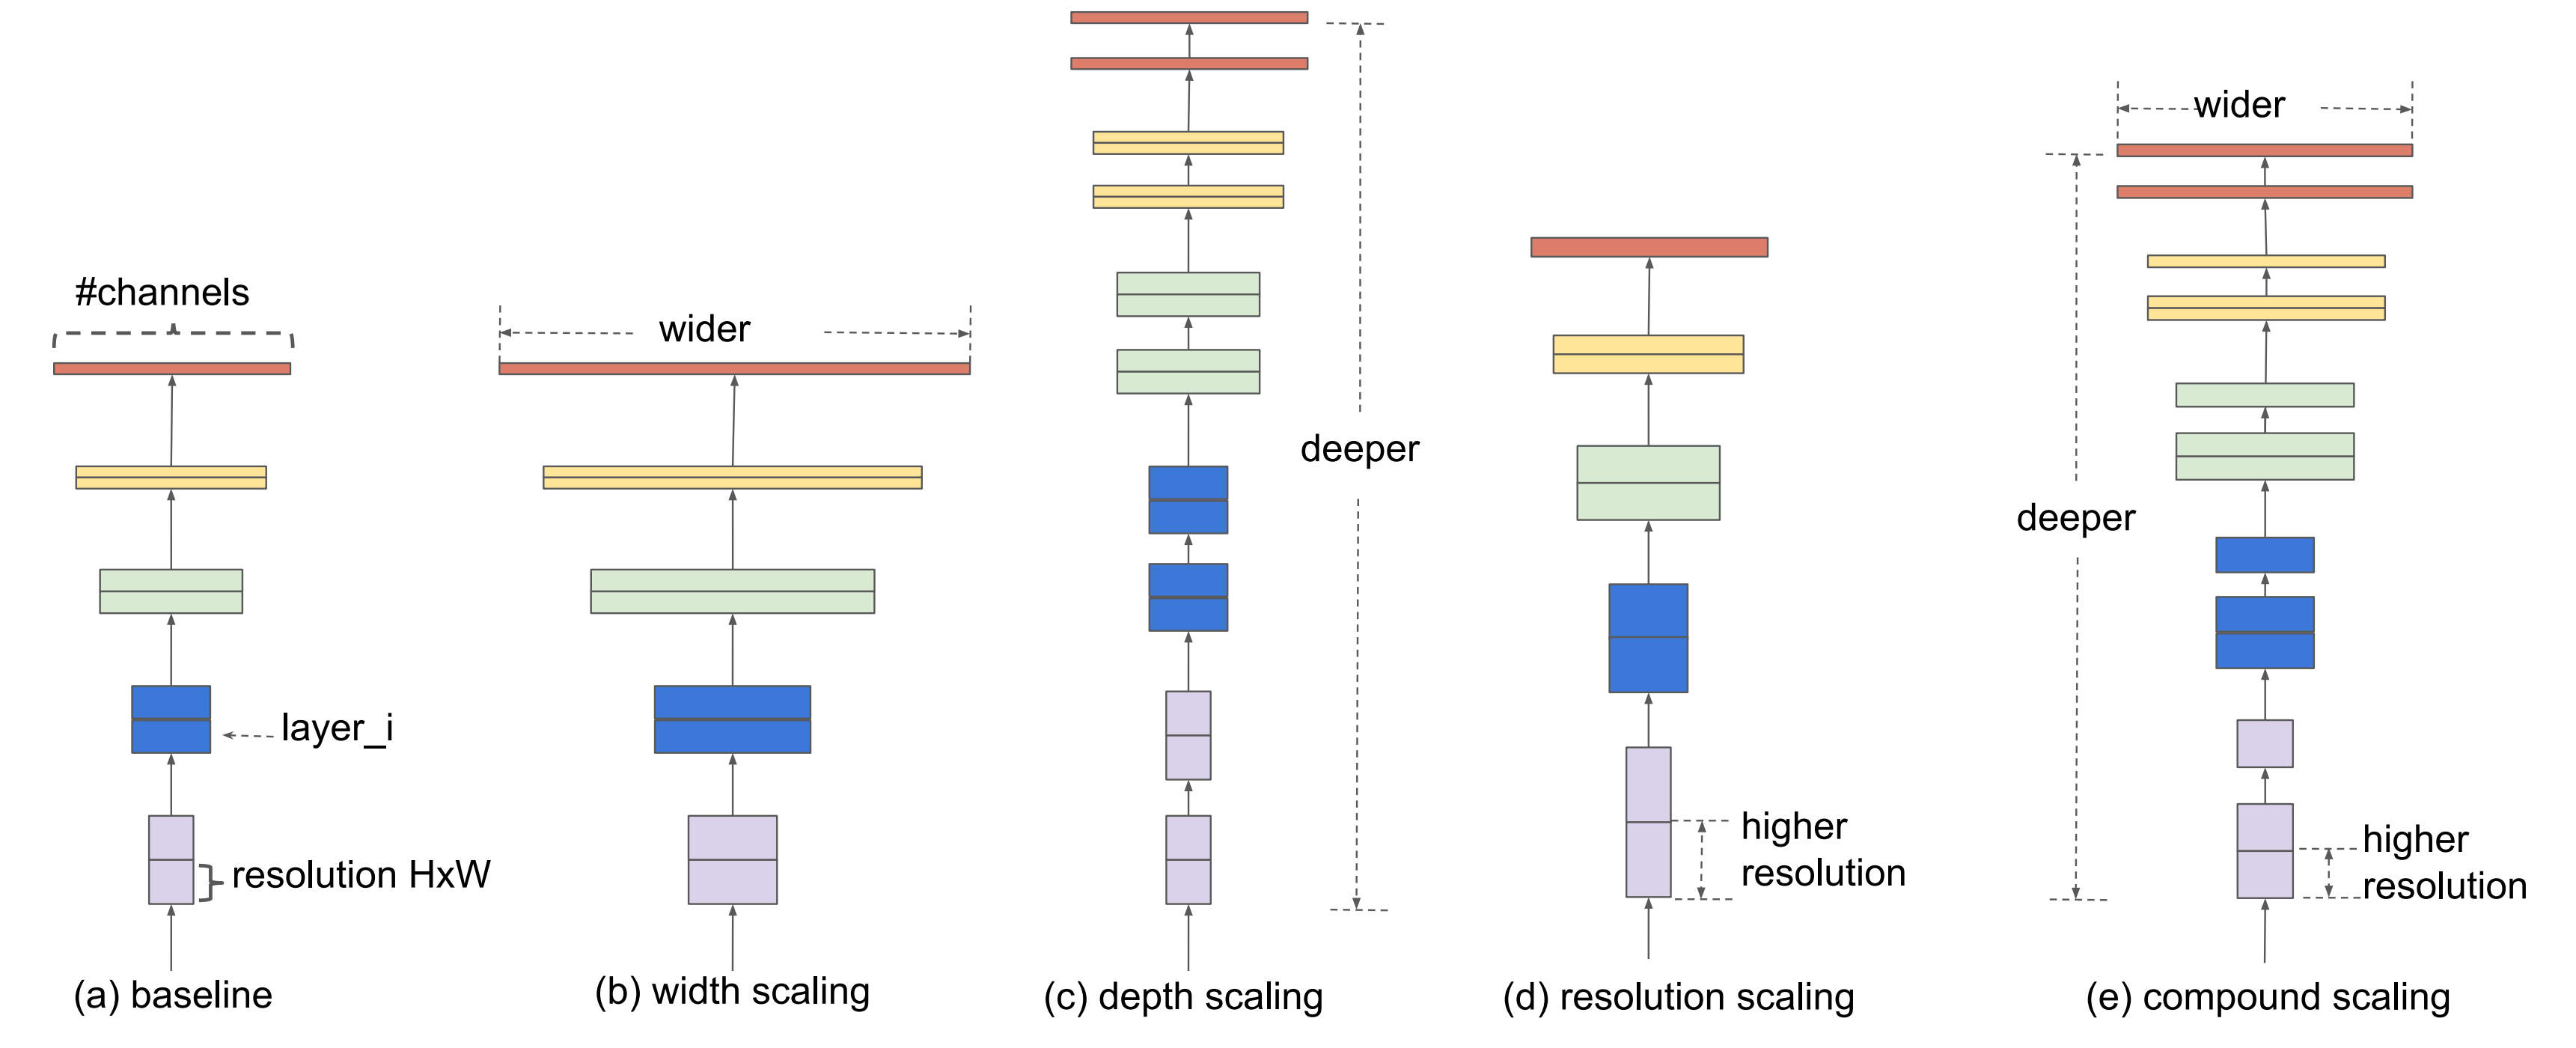
The author of the EfficientNet firstly using neural architecture search to find the baseline network, which ensures the whole architecture to be smaller and more accurate. And then he proposes a compound scaling method, uniform scale network width, depth and resolution using a composite factor φ. He scaled up the baseline model by this composite factor and come up with the EfficientNet.
To test the robustness of the scaling method, the author applies the scaling method to MobileNets and Resnets, showing that the composite scaling method improves the accuracy of all these models.
Model Scaling.
AlexNet
Traditional CNN, just as a control group to evaluate the performance of the EfficientNet and the ResNet.
Results
We evaluate the model by the training loss/accuracy graph, confusion matrix and the statistic information.
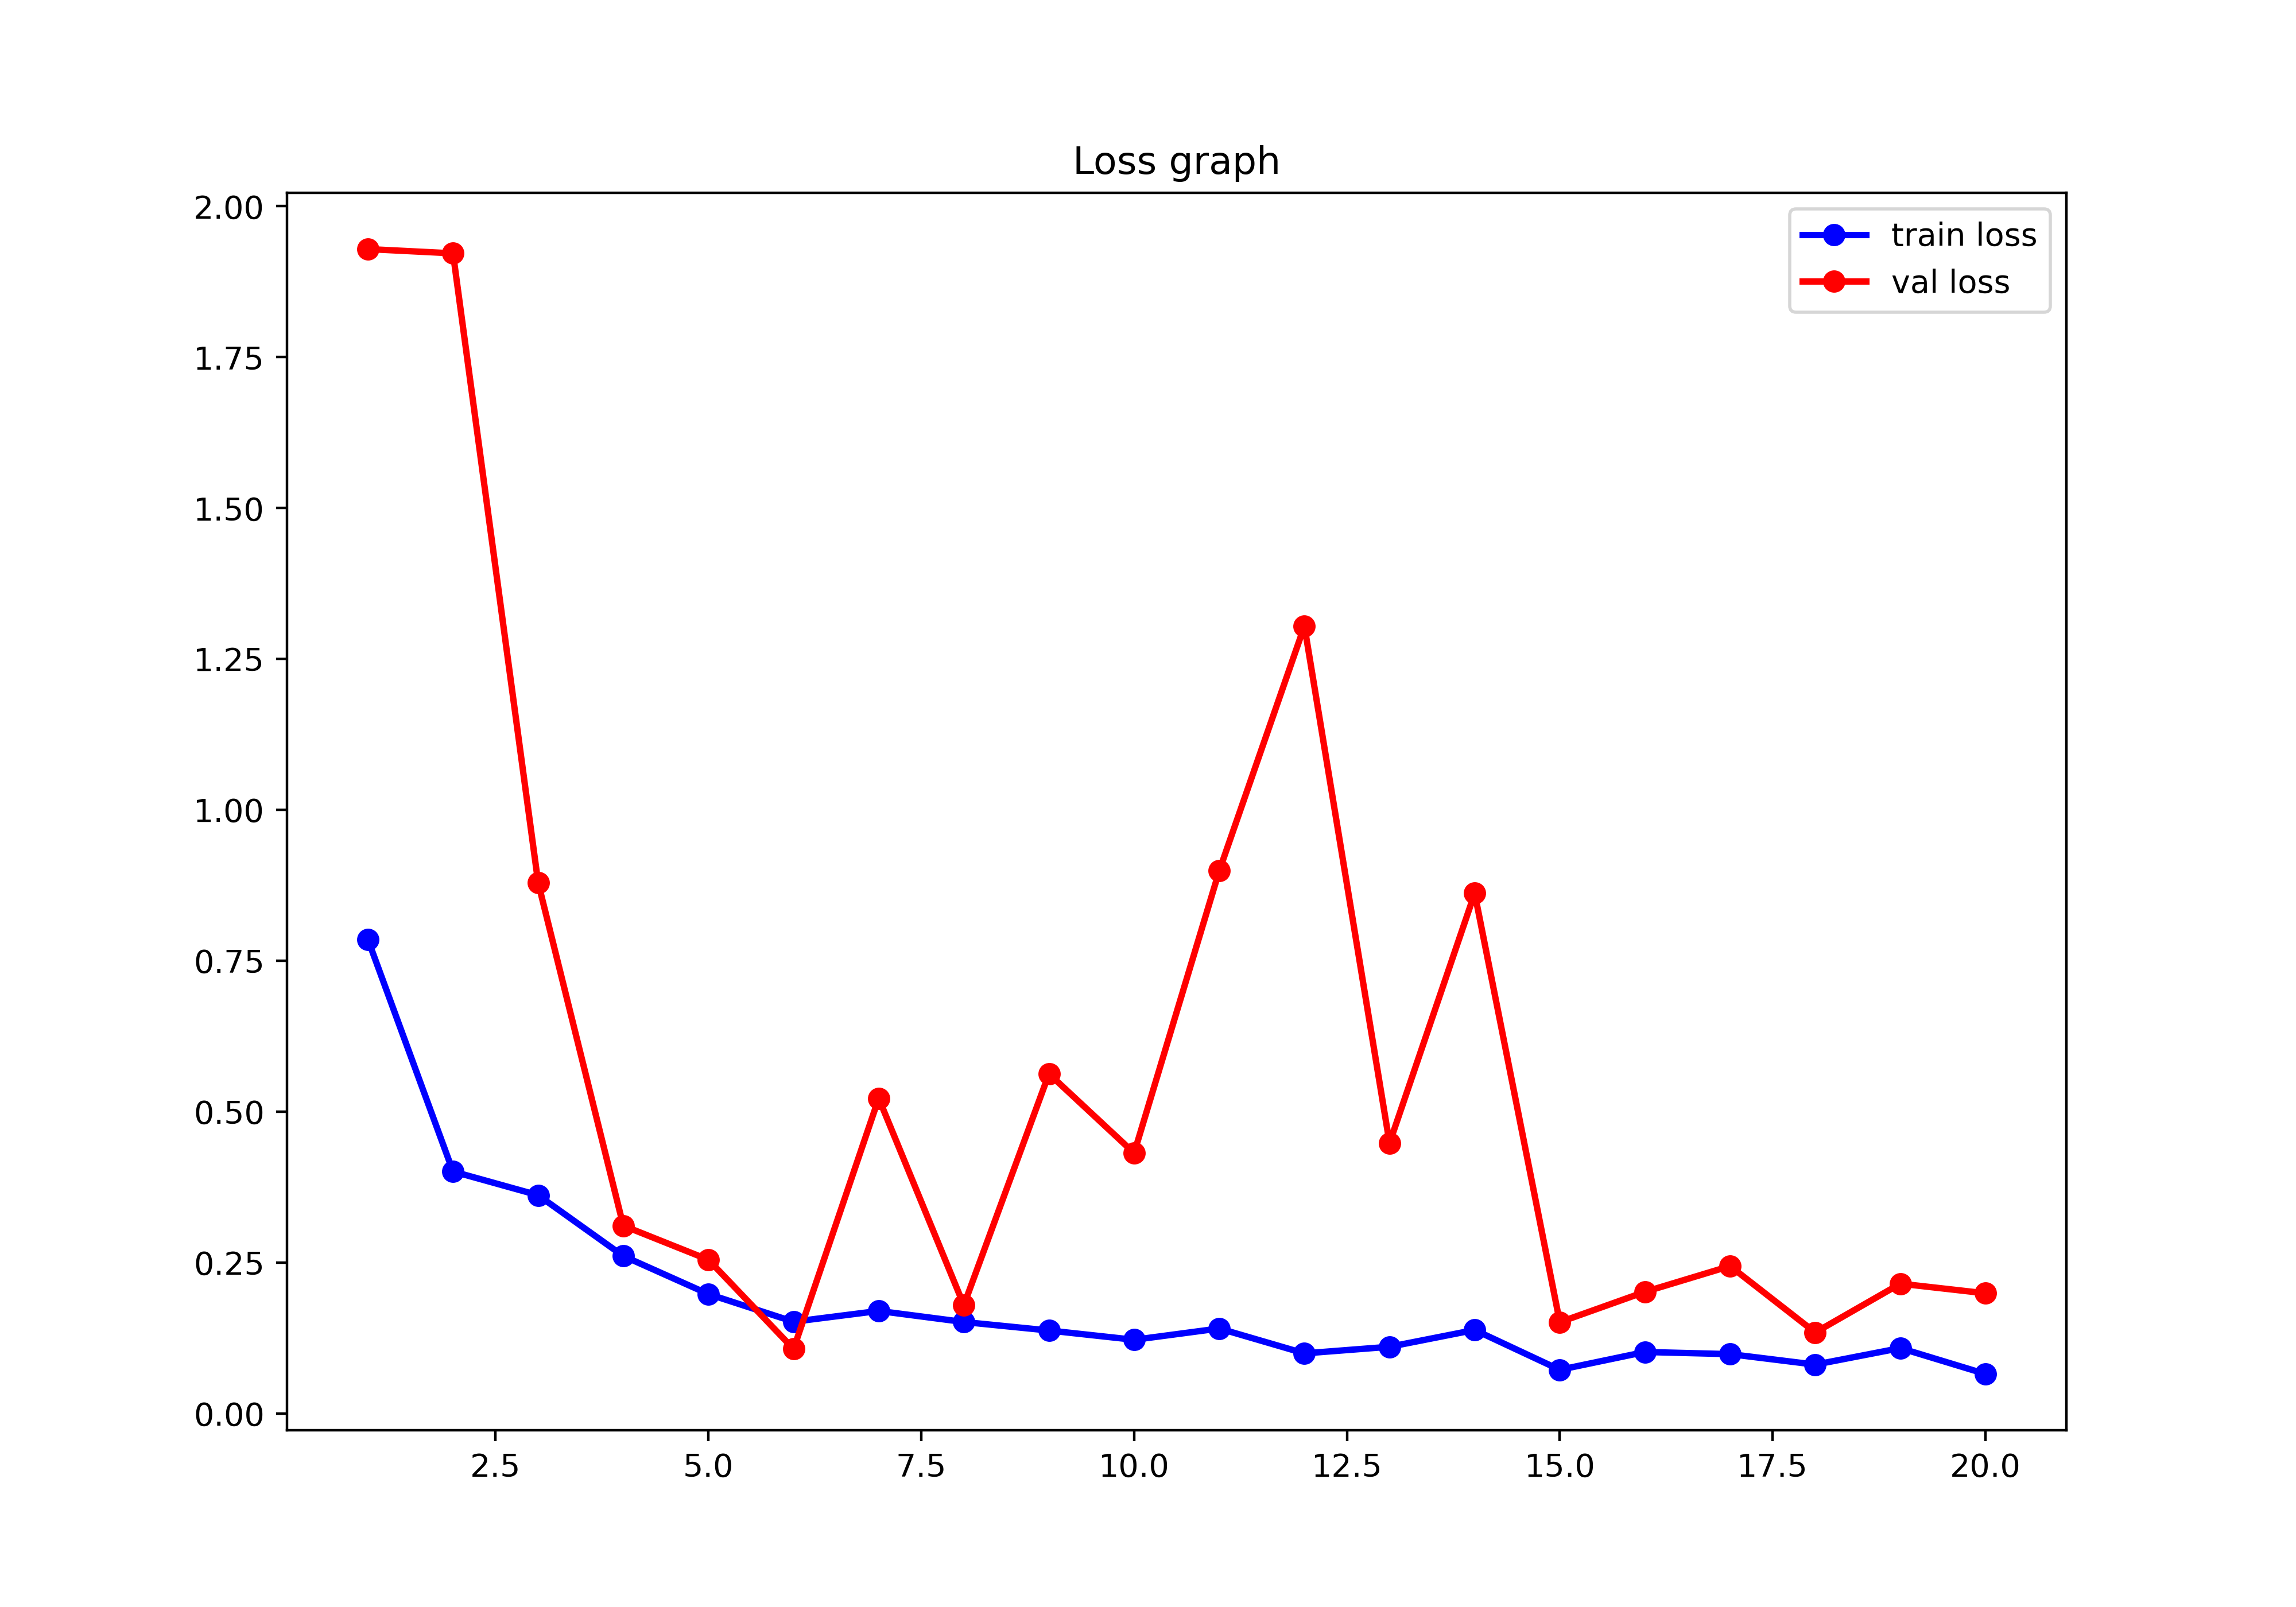
The result of the EfficientNet
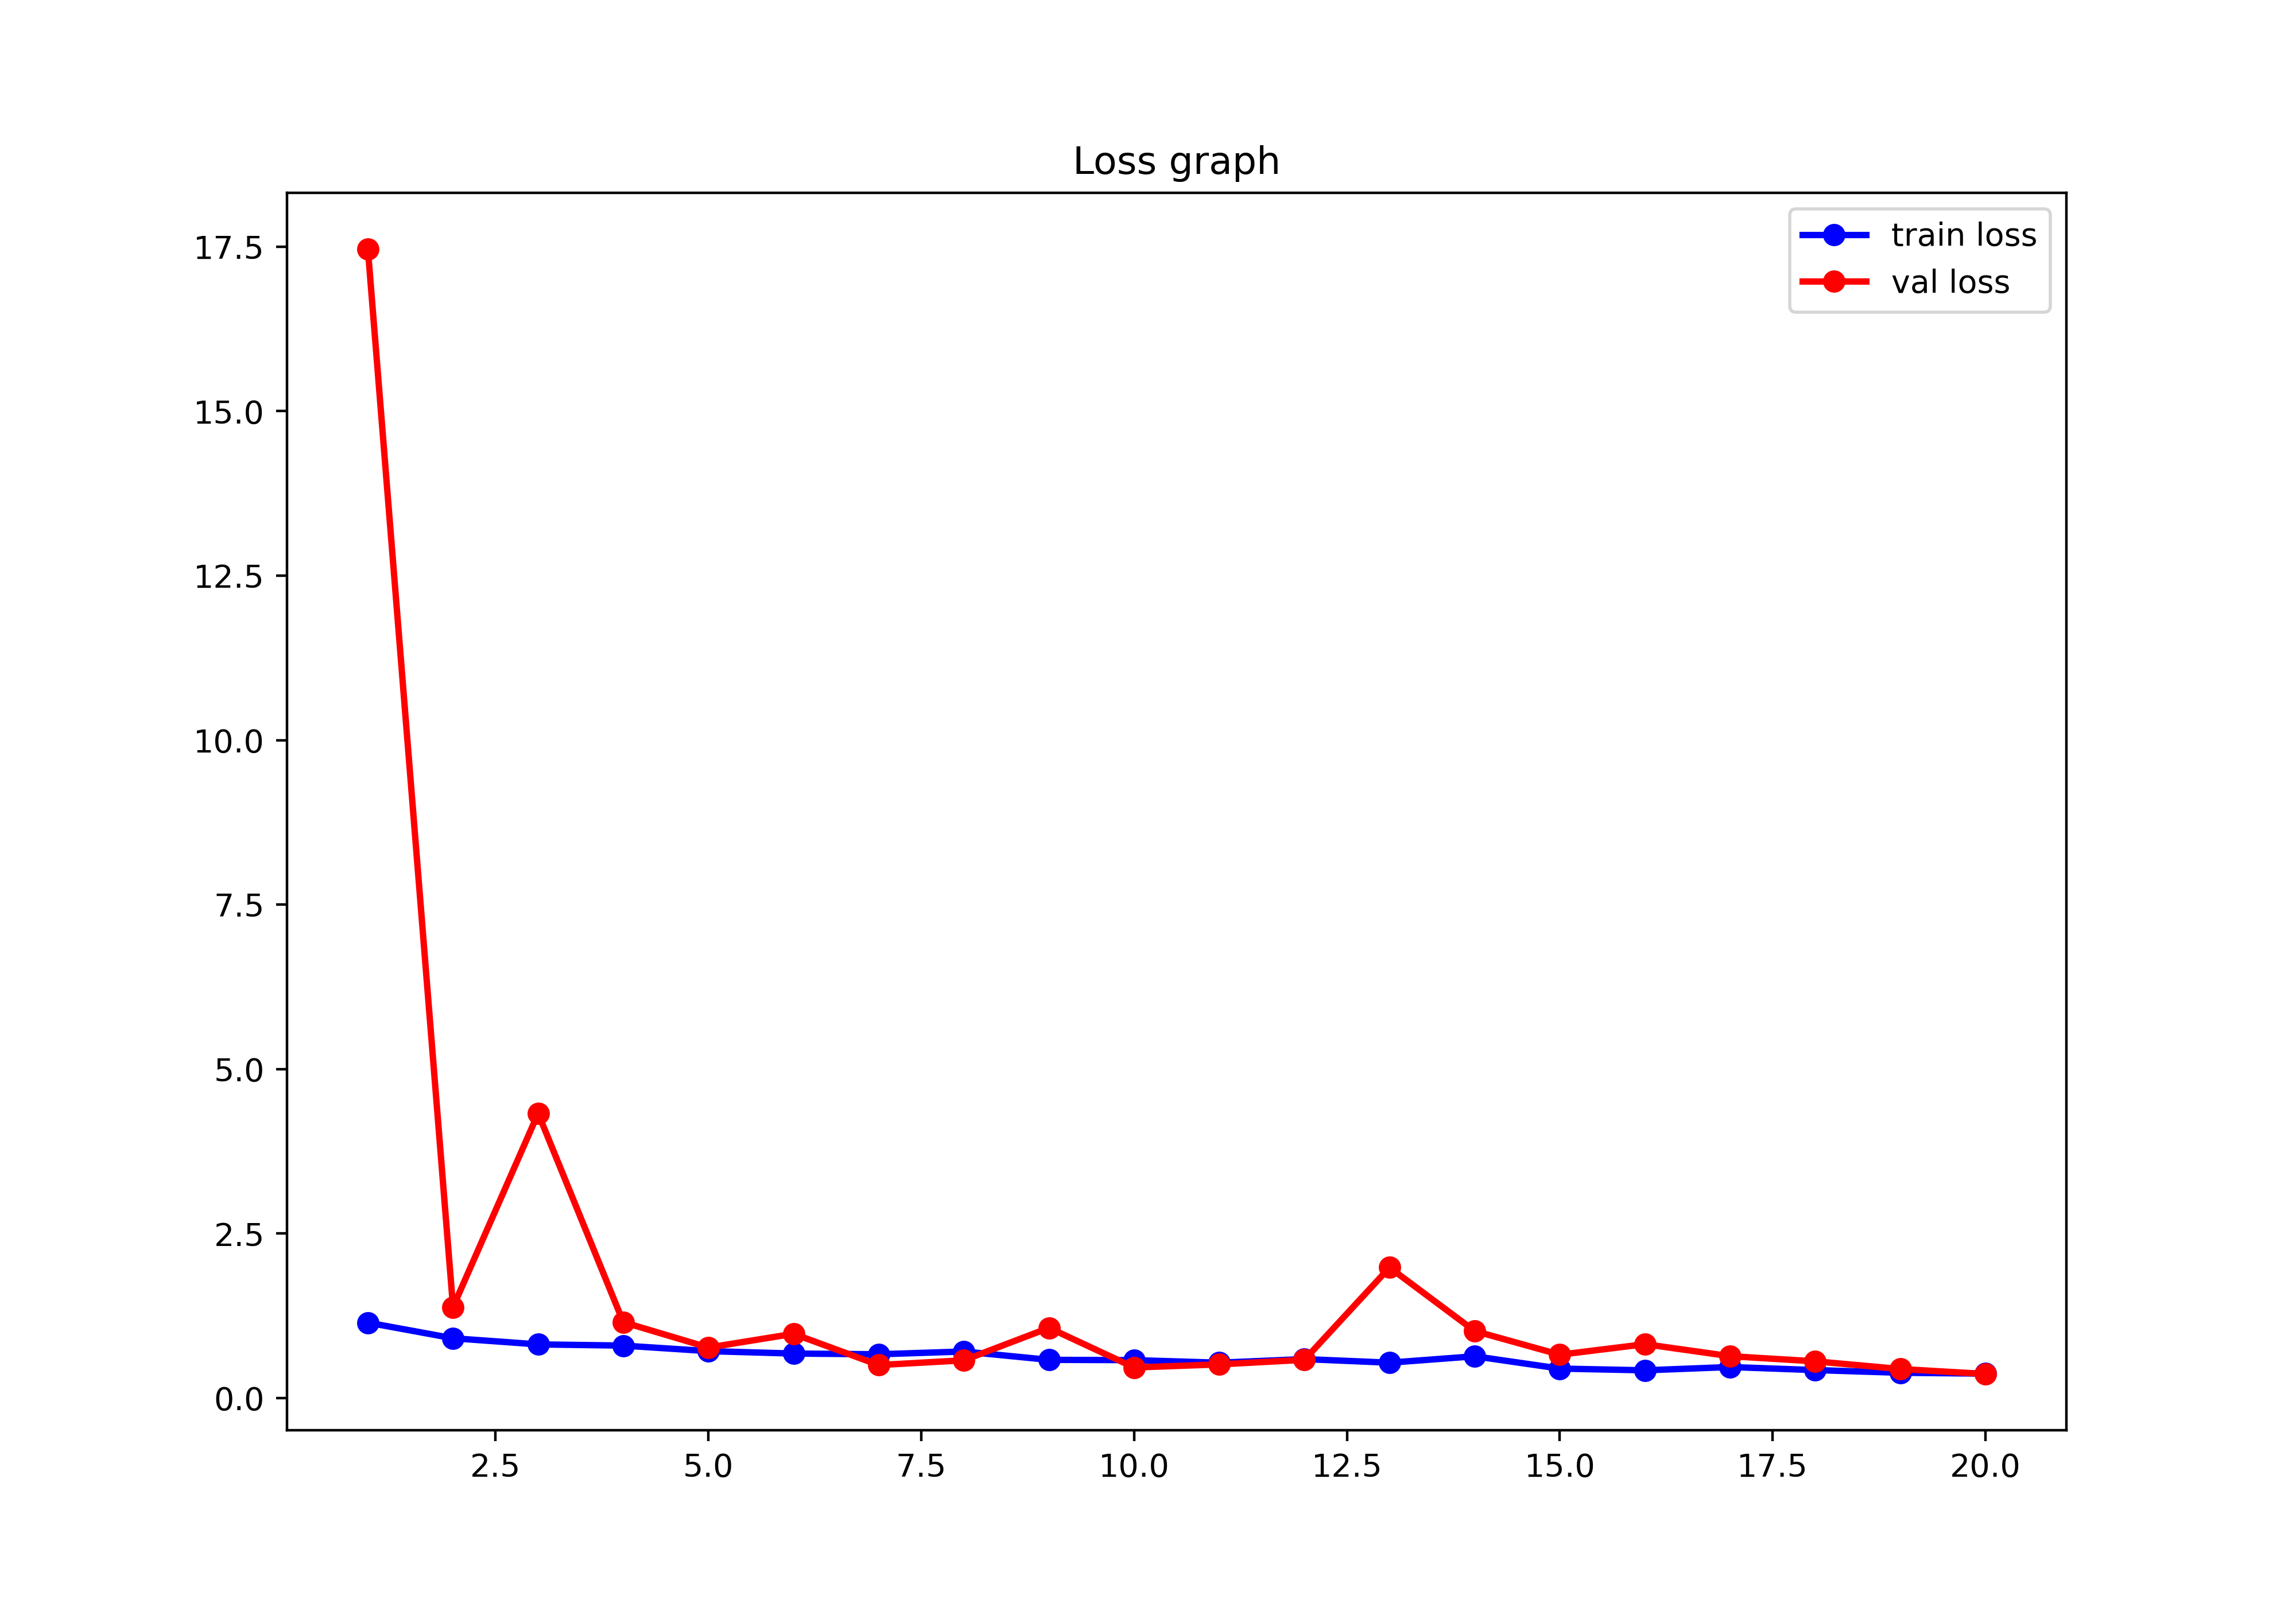
The loss decreasing graph of the EfficientNet.
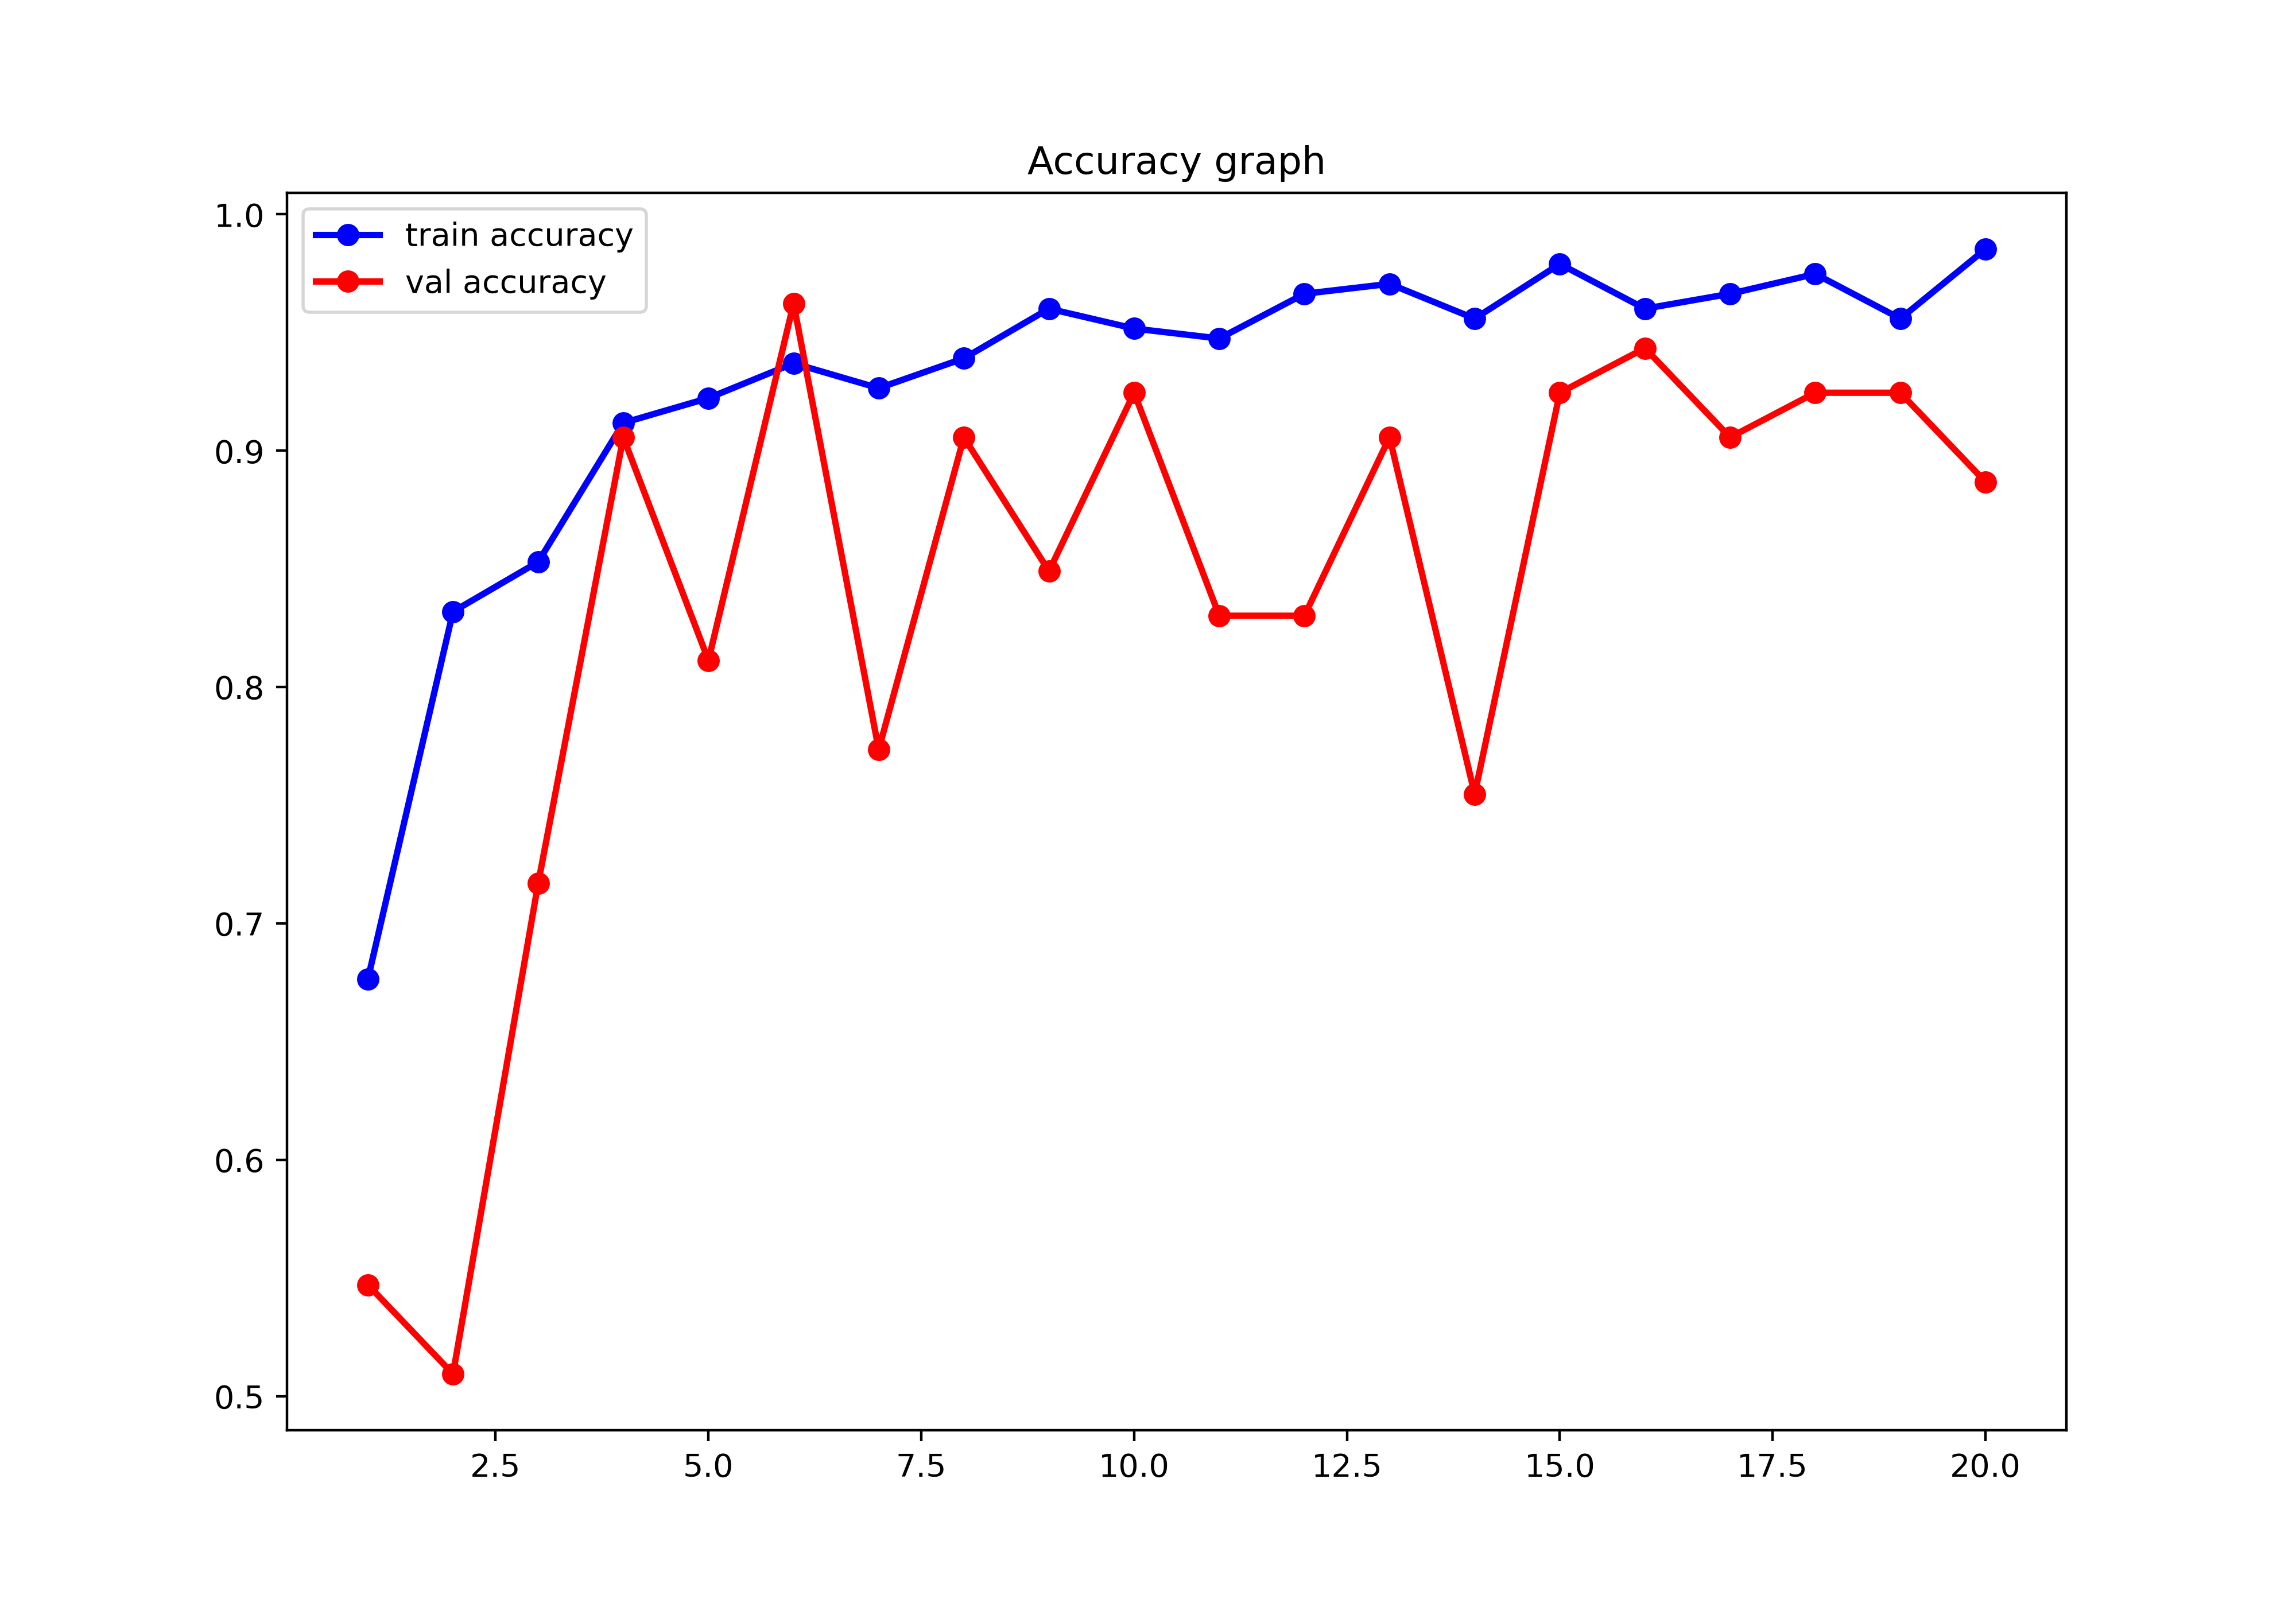
The accuracy increasing graph of the EfficientNet.
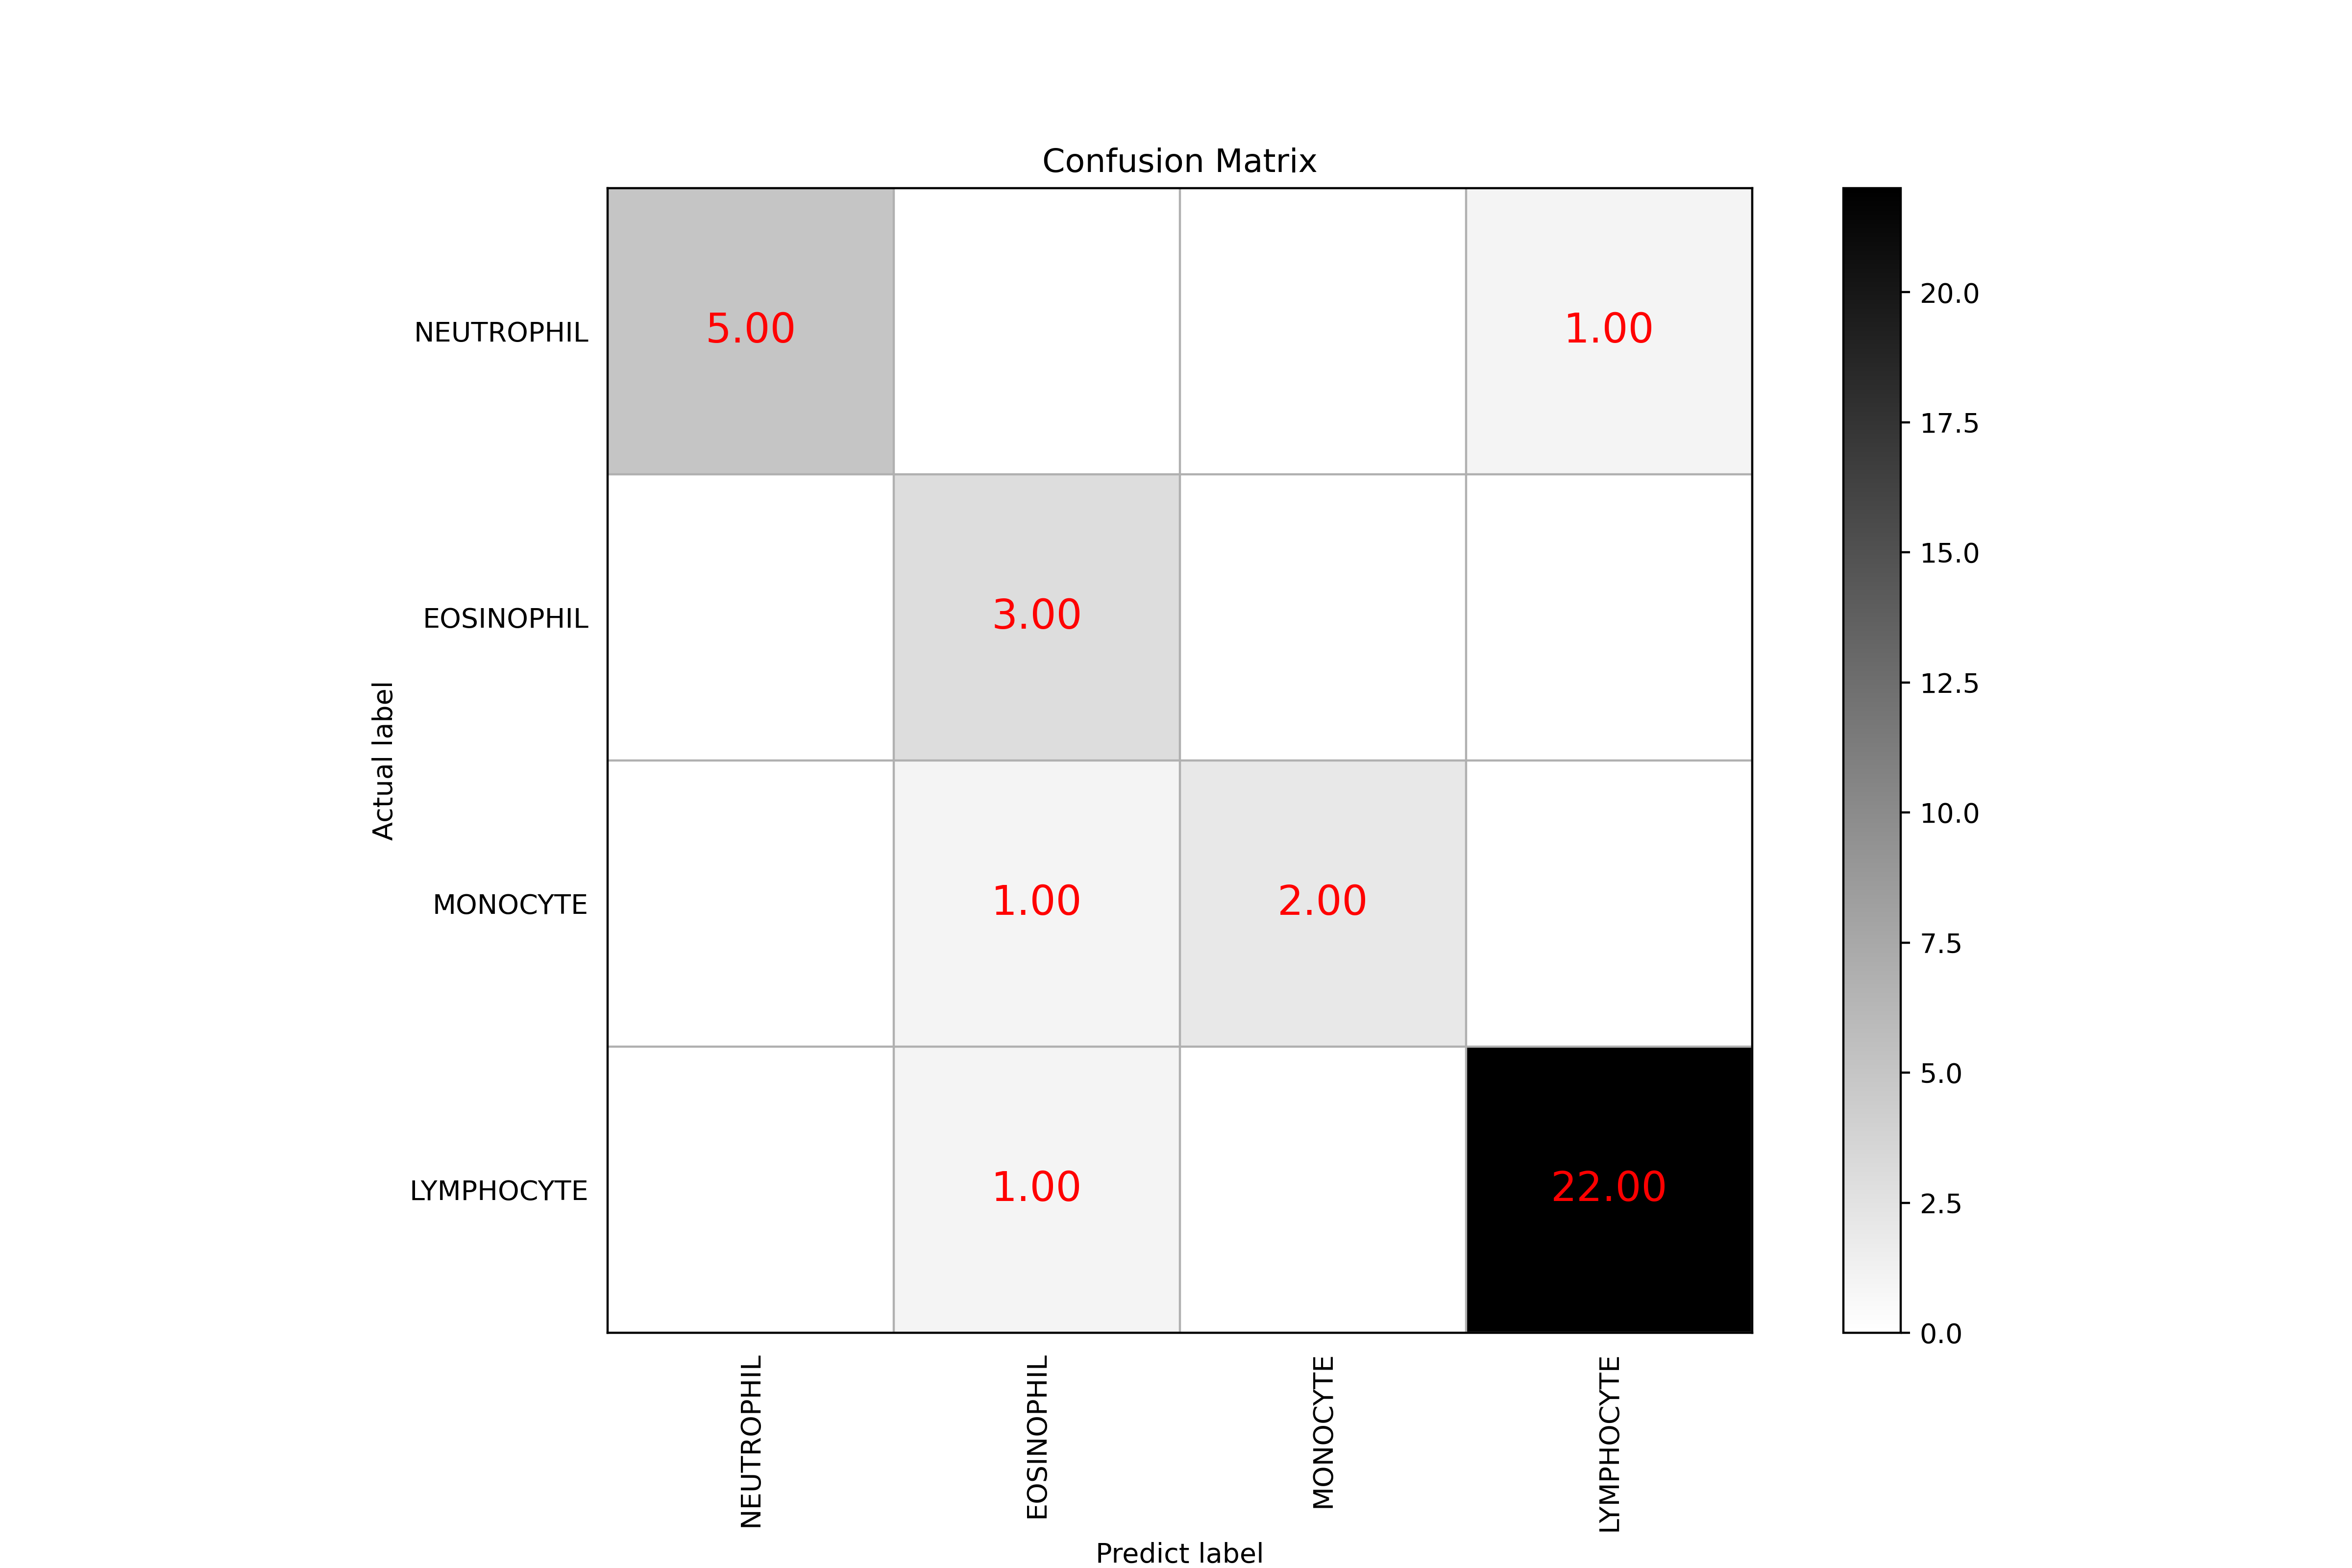
The confusion matrix of the EfficientNet.
The statistic information of the EfficientNet:
The number of right prediction is 32
The number of total prediction is 35
The accuracy is 0.914
For type NEUTROPHIL:
The recall/sensitivity is 0.833
The specificity is 1.000
The precision is 1.000
For type EOSINOPHIL:
The recall/sensitivity is 1.000
The specificity is 0.938
The precision is 0.600
For type MONOCYTE:
The recall/sensitivity is 0.667
The specificity is 1.000
The precision is 1.000
For type LYMPHOCYTE:
The recall/sensitivity is 0.957
The specificity is 0.917
The precision is 0.957
The result of the ResNet
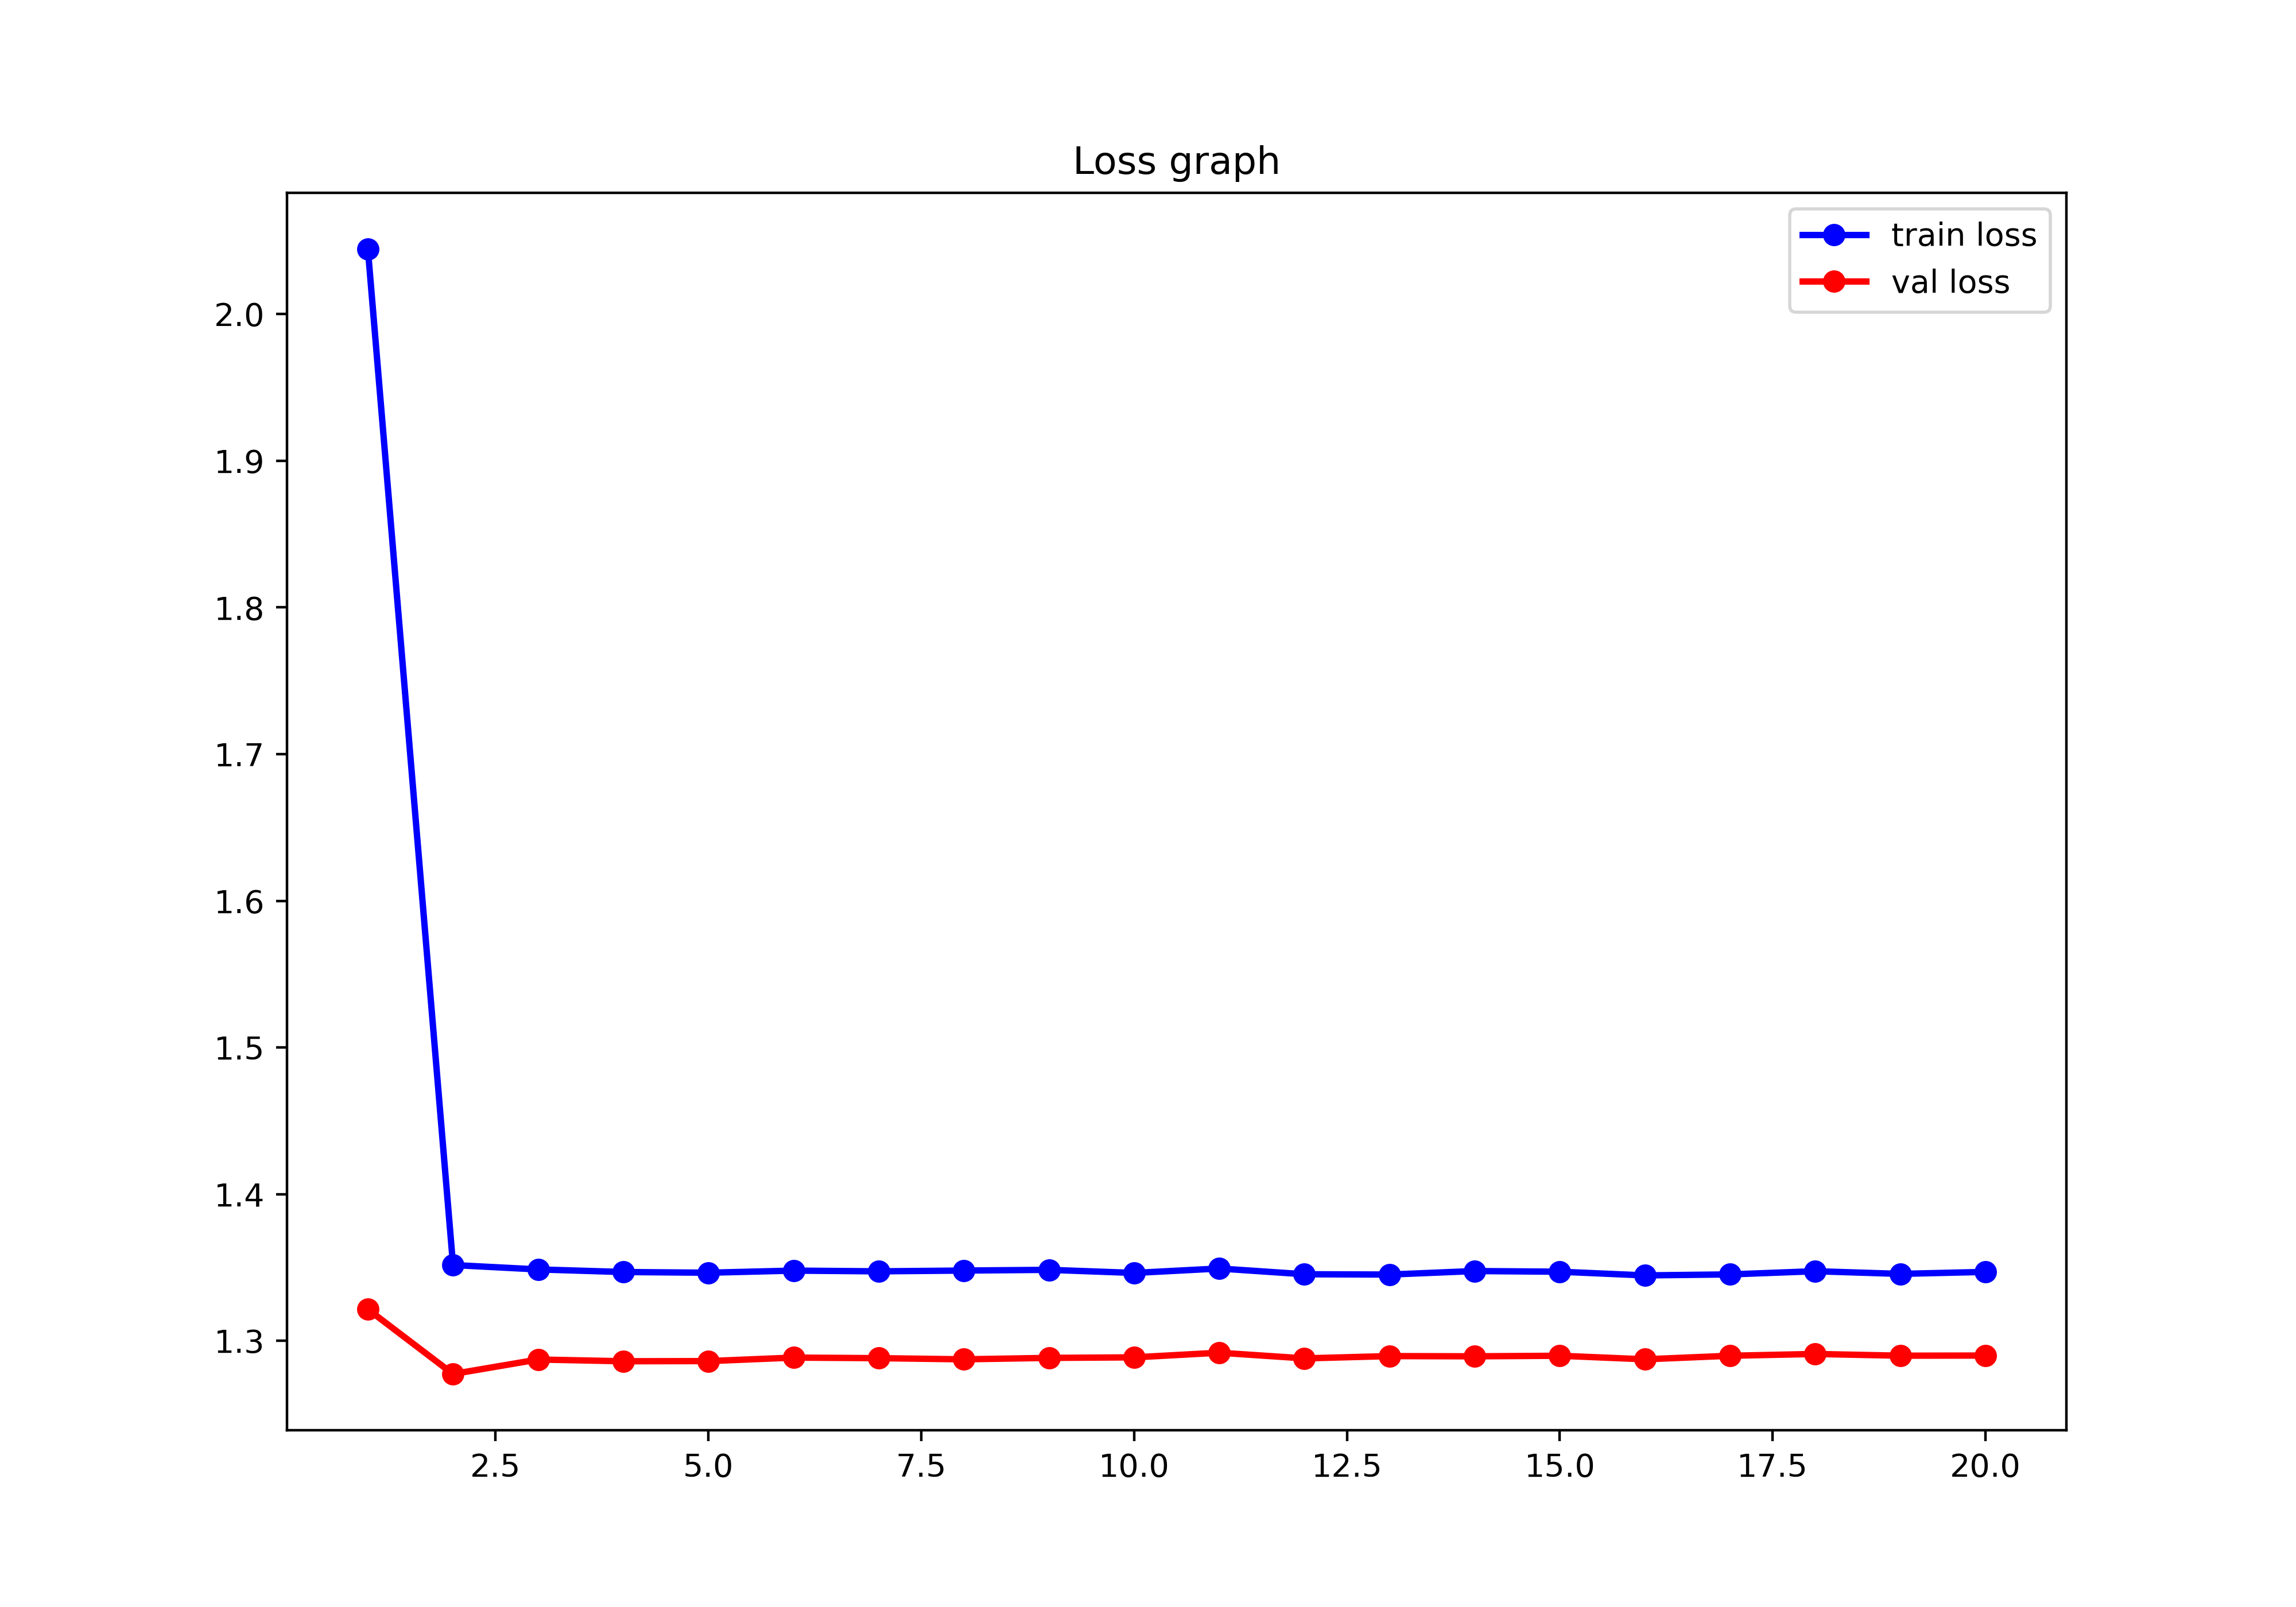
The loss decreasing graph of the ResNet.
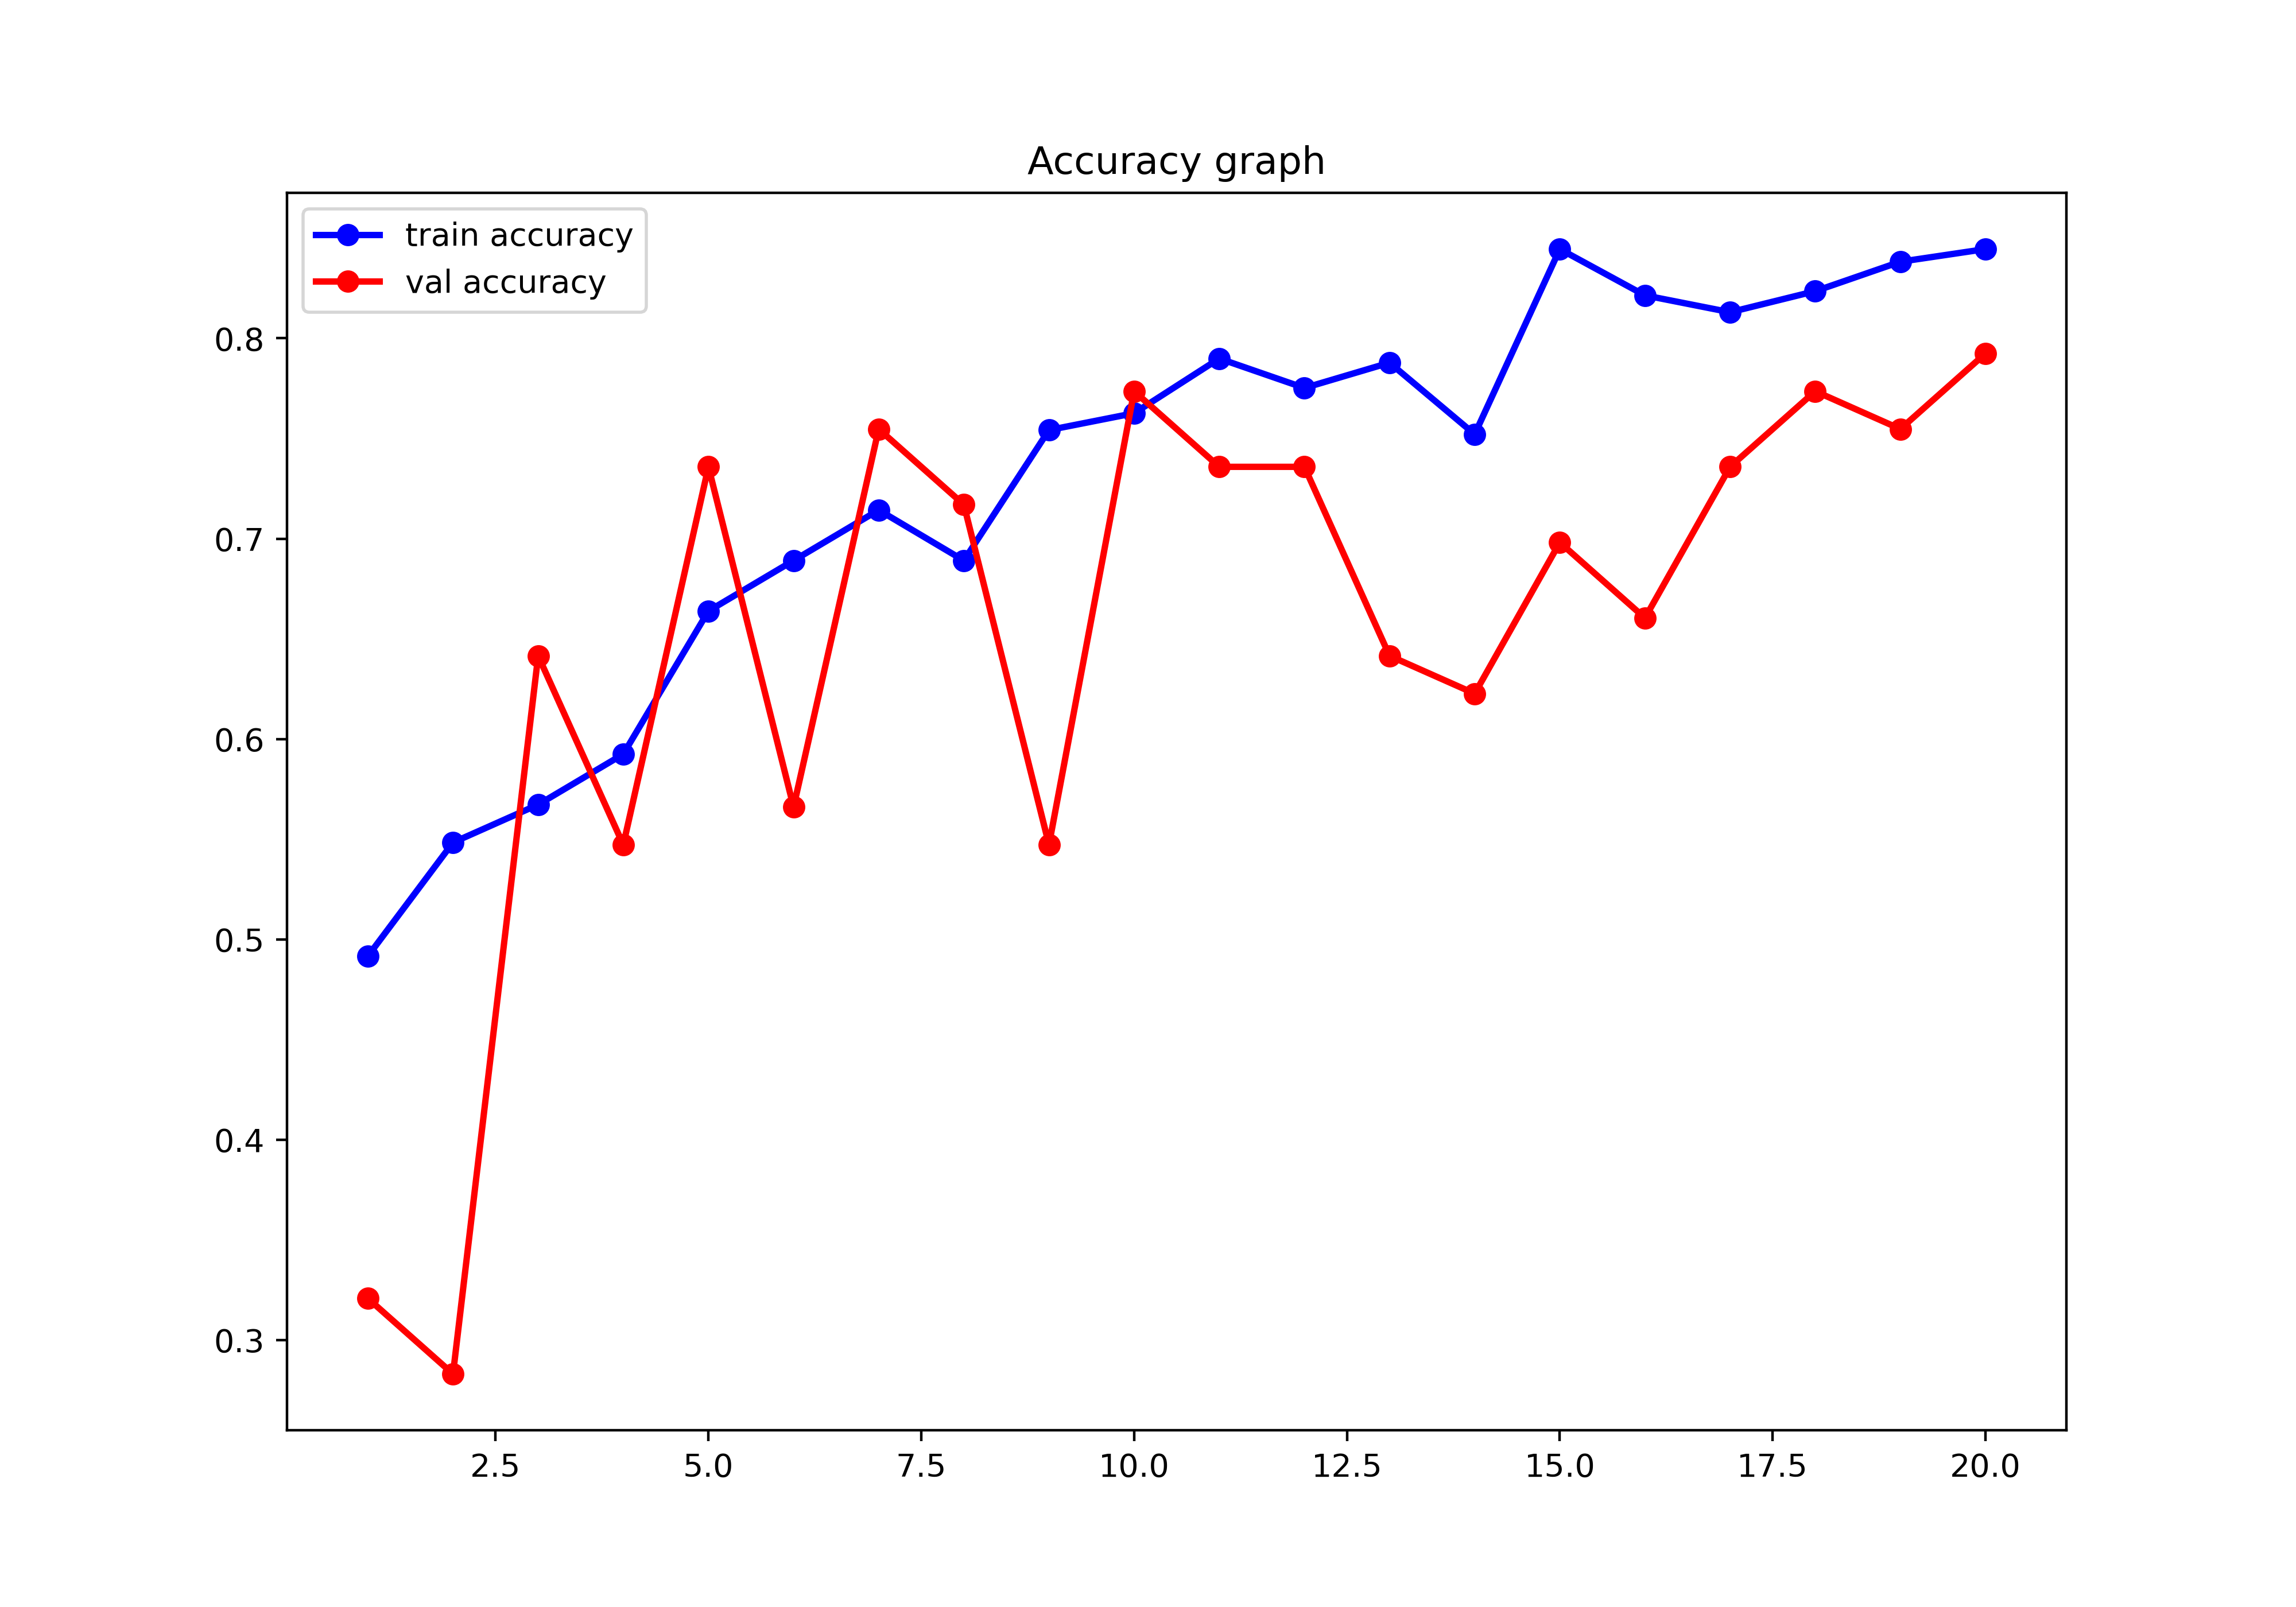
The accuracy increasing graph of the ResNet.
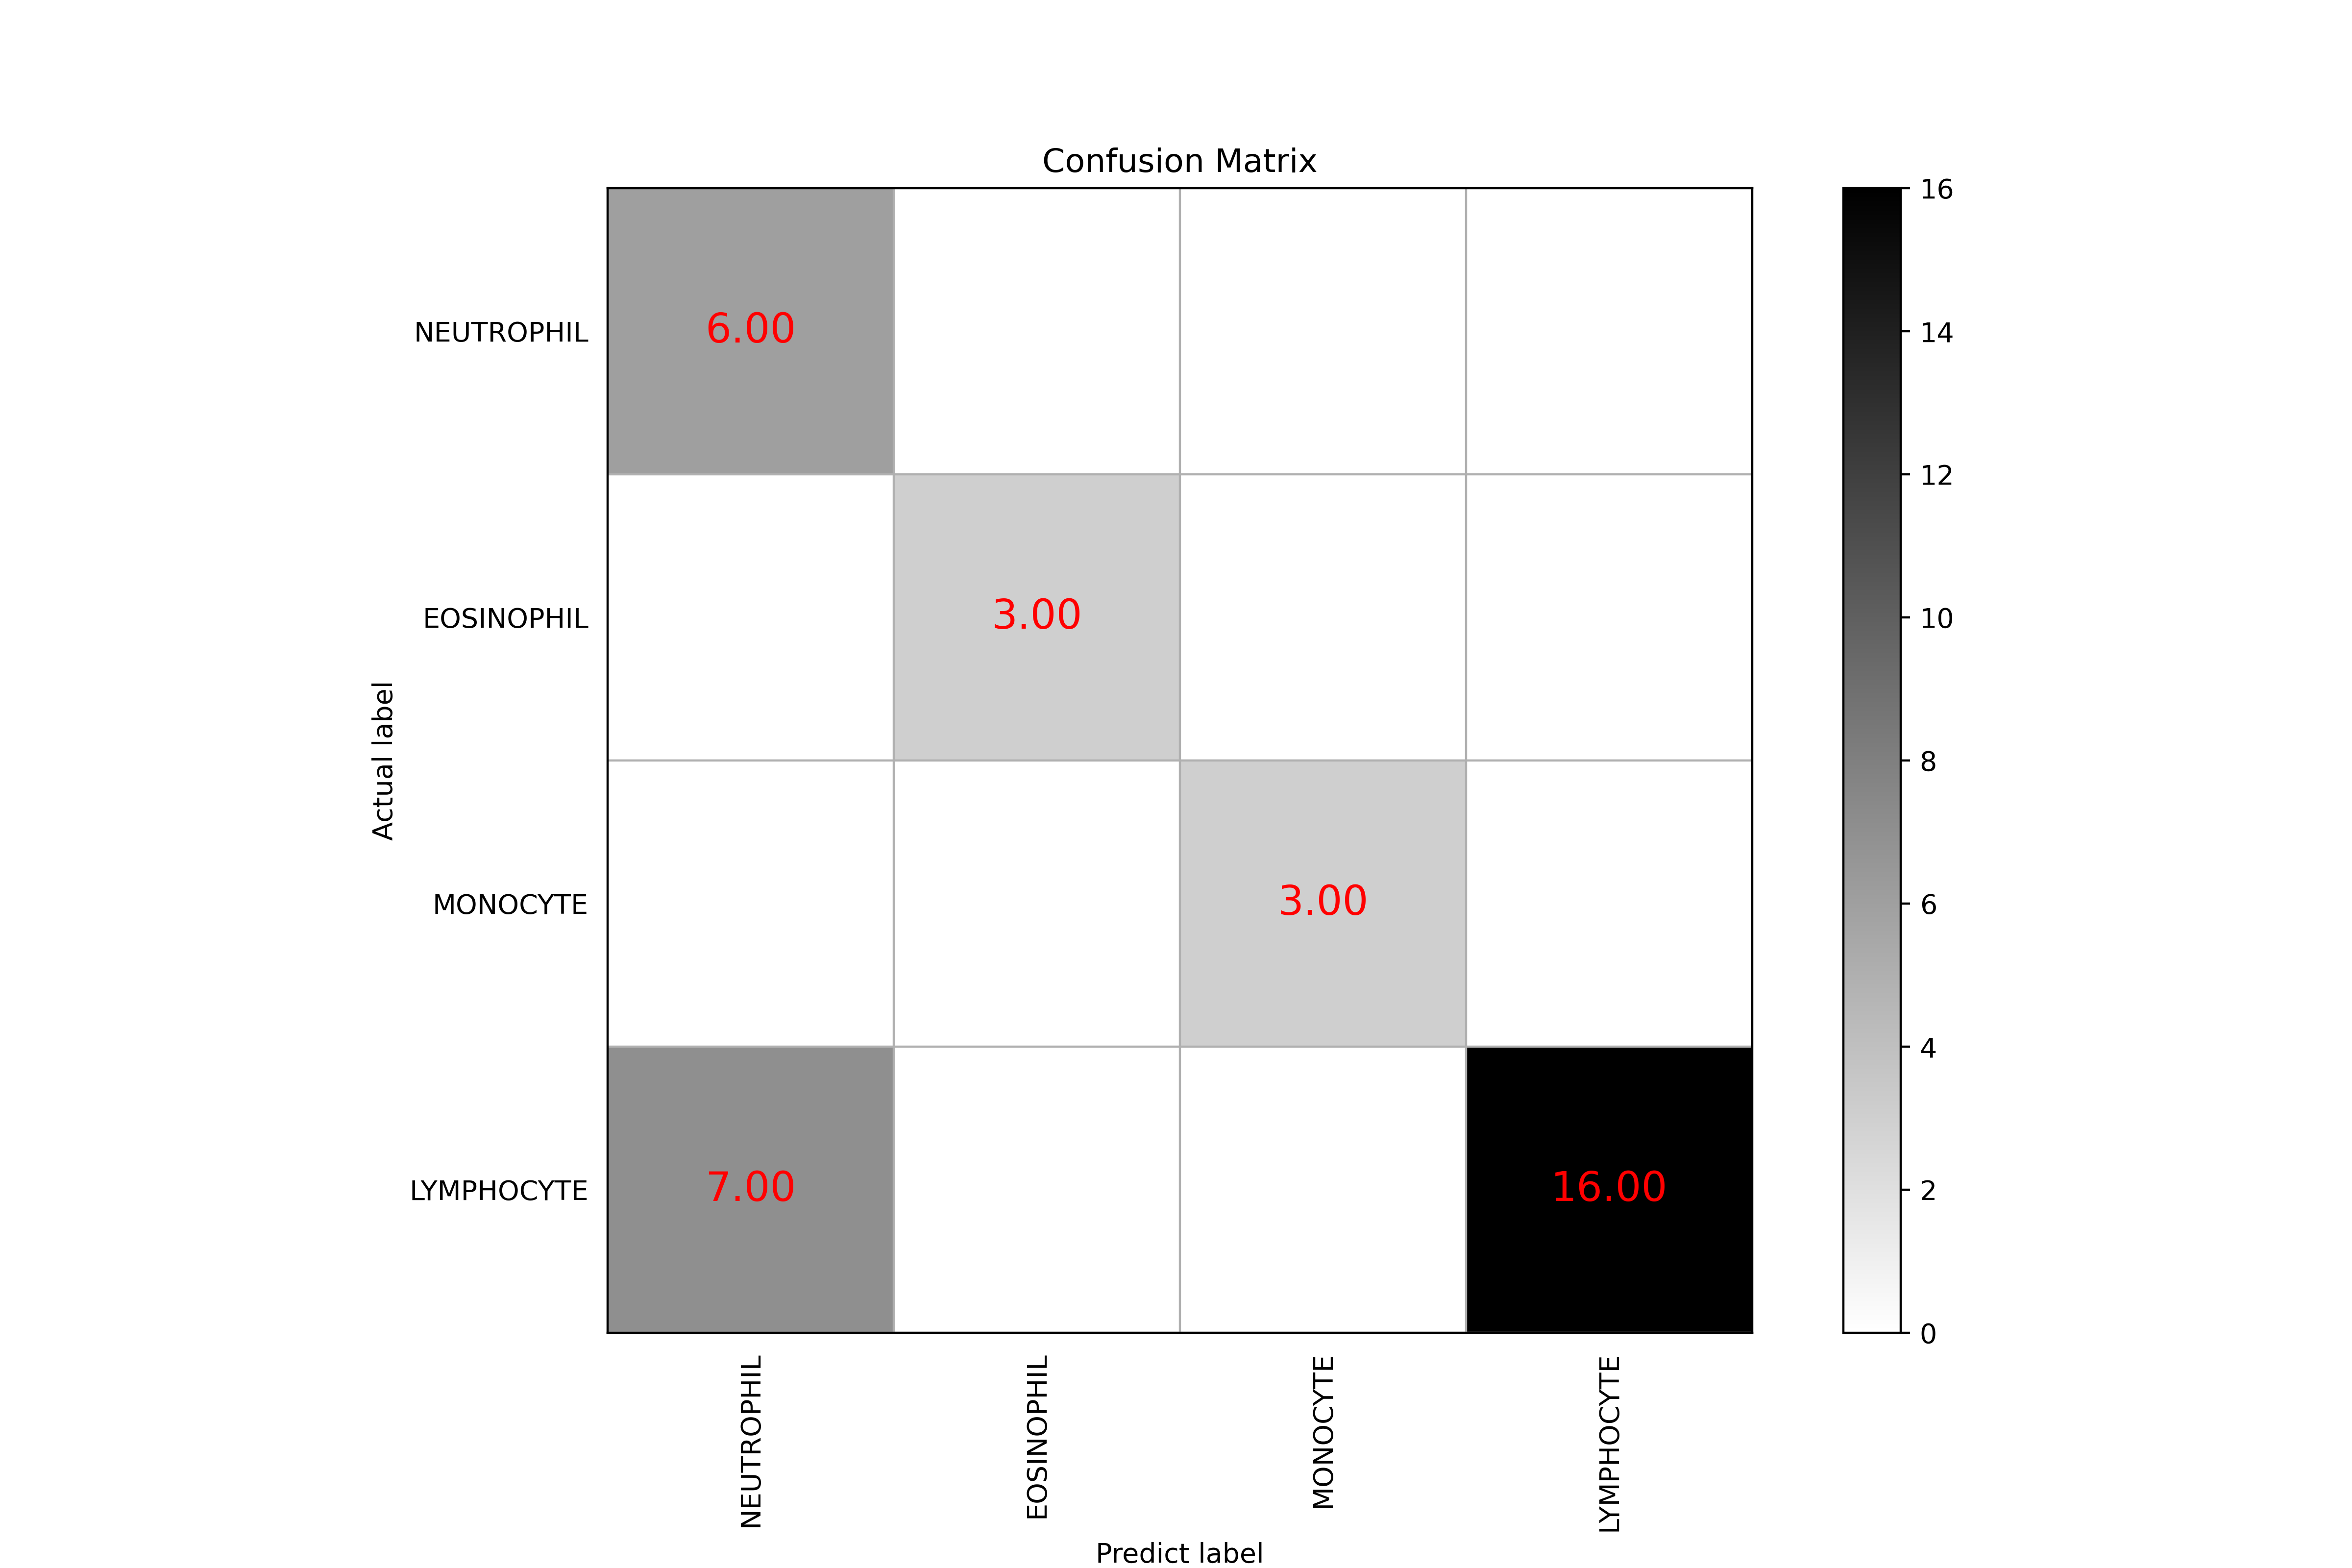
The confusion matrix of the ResNet.
The statistic information of the ResNet:
The number of right prediction is 28
The number of total prediction is 35
The accuracy is 0.800
For type NEUTROPHIL:
The recall/sensitivity is 1.000
The specificity is 0.759
The precision is 0.462
For type EOSINOPHIL:
The recall/sensitivity is 1.000
The specificity is 1.000
The precision is 1.000
For type MONOCYTE:
The recall/sensitivity is 1.000
The specificity is 1.000
The precision is 1.000
For type LYMPHOCYTE:
The recall/sensitivity is 0.696
The specificity is 1.000
The precision is 1.000
The result of the AlexNet
The loss decreasing graph of the AlexNet.
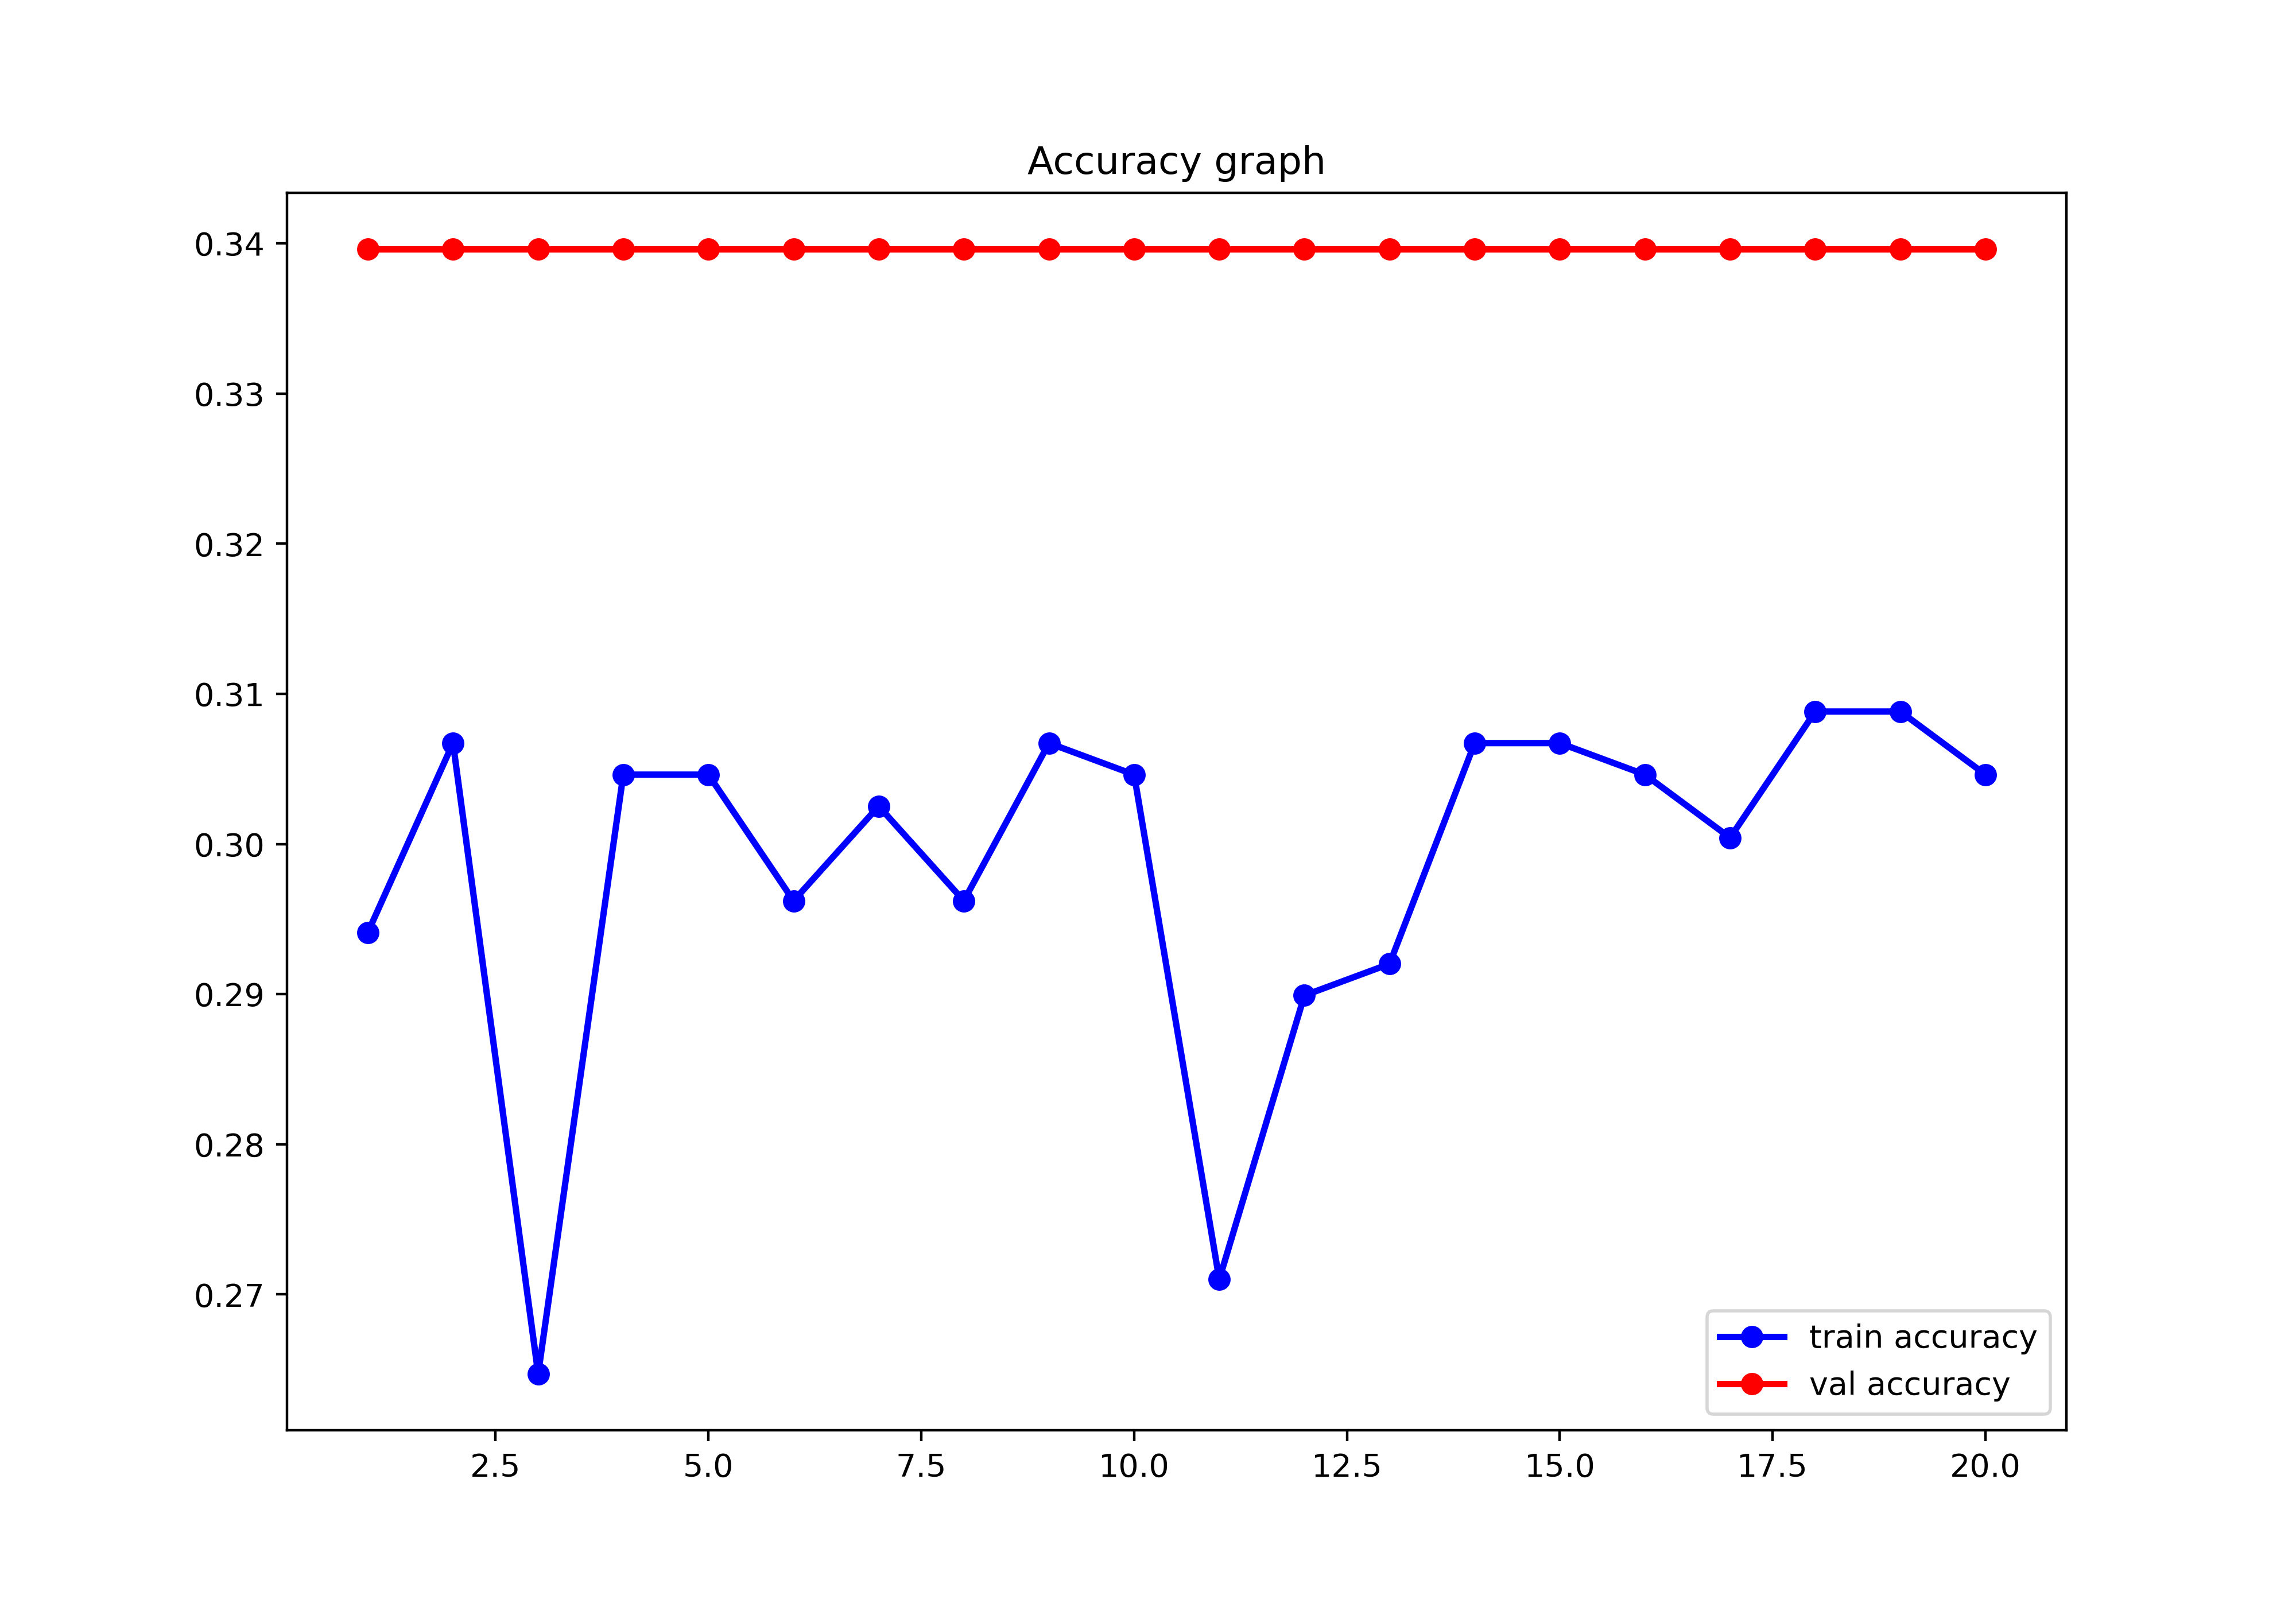
The accuracy increasing graph of the AlexNet.
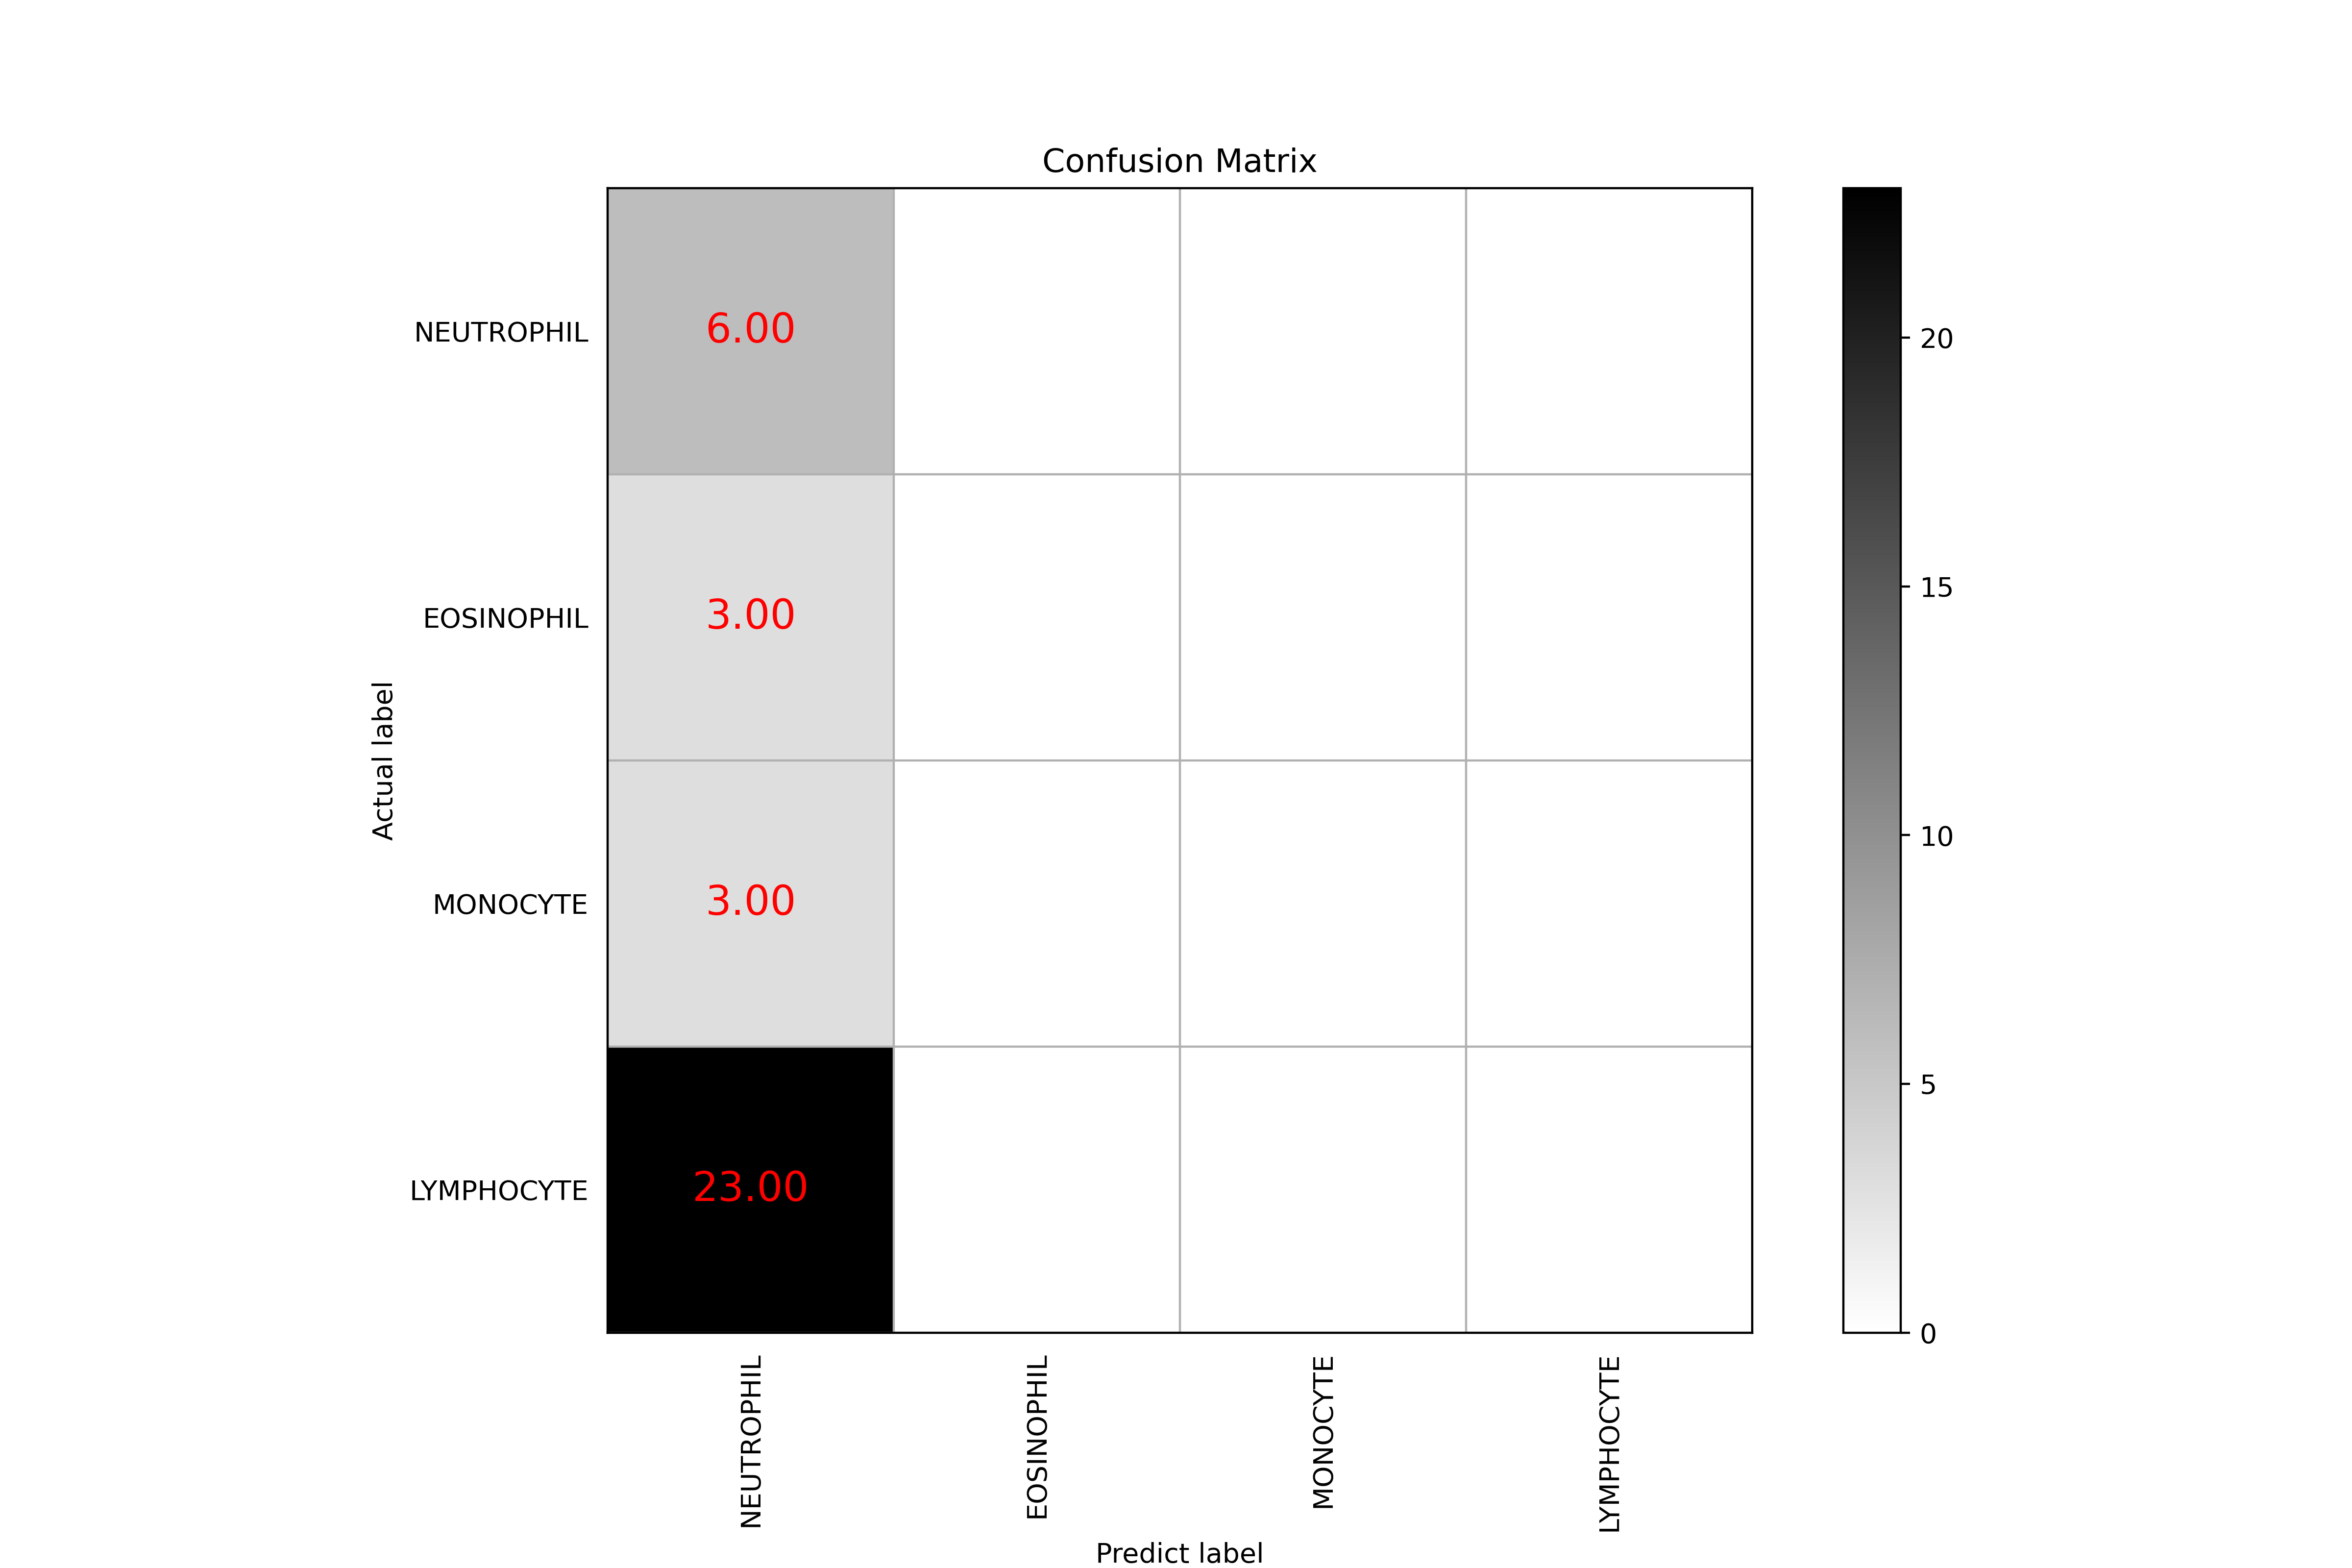
The confusion matrix of the AlexNet.
The statistic information of the AlexNet:
The number of right prediction is 6
The number of total prediction is 35
The accuracy is 0.171
For type NEUTROPHIL:
The recall/sensitivity is 1.000
The specificity is 0.000
The precision is 0.171
For type EOSINOPHIL:
The recall/sensitivity is 0.000
The specificity is 1.000
The precision is 0
For type MONOCYTE:
The recall/sensitivity is 0.000
The specificity is 1.000
The precision is 0
For type LYMPHOCYTE:
The recall/sensitivity is 0.000
The specificity is 1.000
The precision is 0
Obviously, the AlexNet can’t catch enough feature to make right decision.
Models comparison
Model
Accuracy
Average sensitivity
Average specificity
AlexNet
0.17
0.25
0.75
ResNet
0.80
9.92
0.94
EfficientNet
0.91
0.86
0.97
Conclusion
In this project, I trained 3 classification models and test their performance. Although the traditional AlexNet
can’t extract enough feature to make right decision, the performance of the ResNet and the EfficientNet
is pretty good. Especially for the EfficientNet, the accuracy of it reach above 90 percent.